Recent data on Bitcoin liquidations and leverage levels indicates unique price discovery activity as longs and shorts have been swept from the market. Much of the leveraged positions were shaken out last week as Bitcoin saw volatile price actions around the US market open.
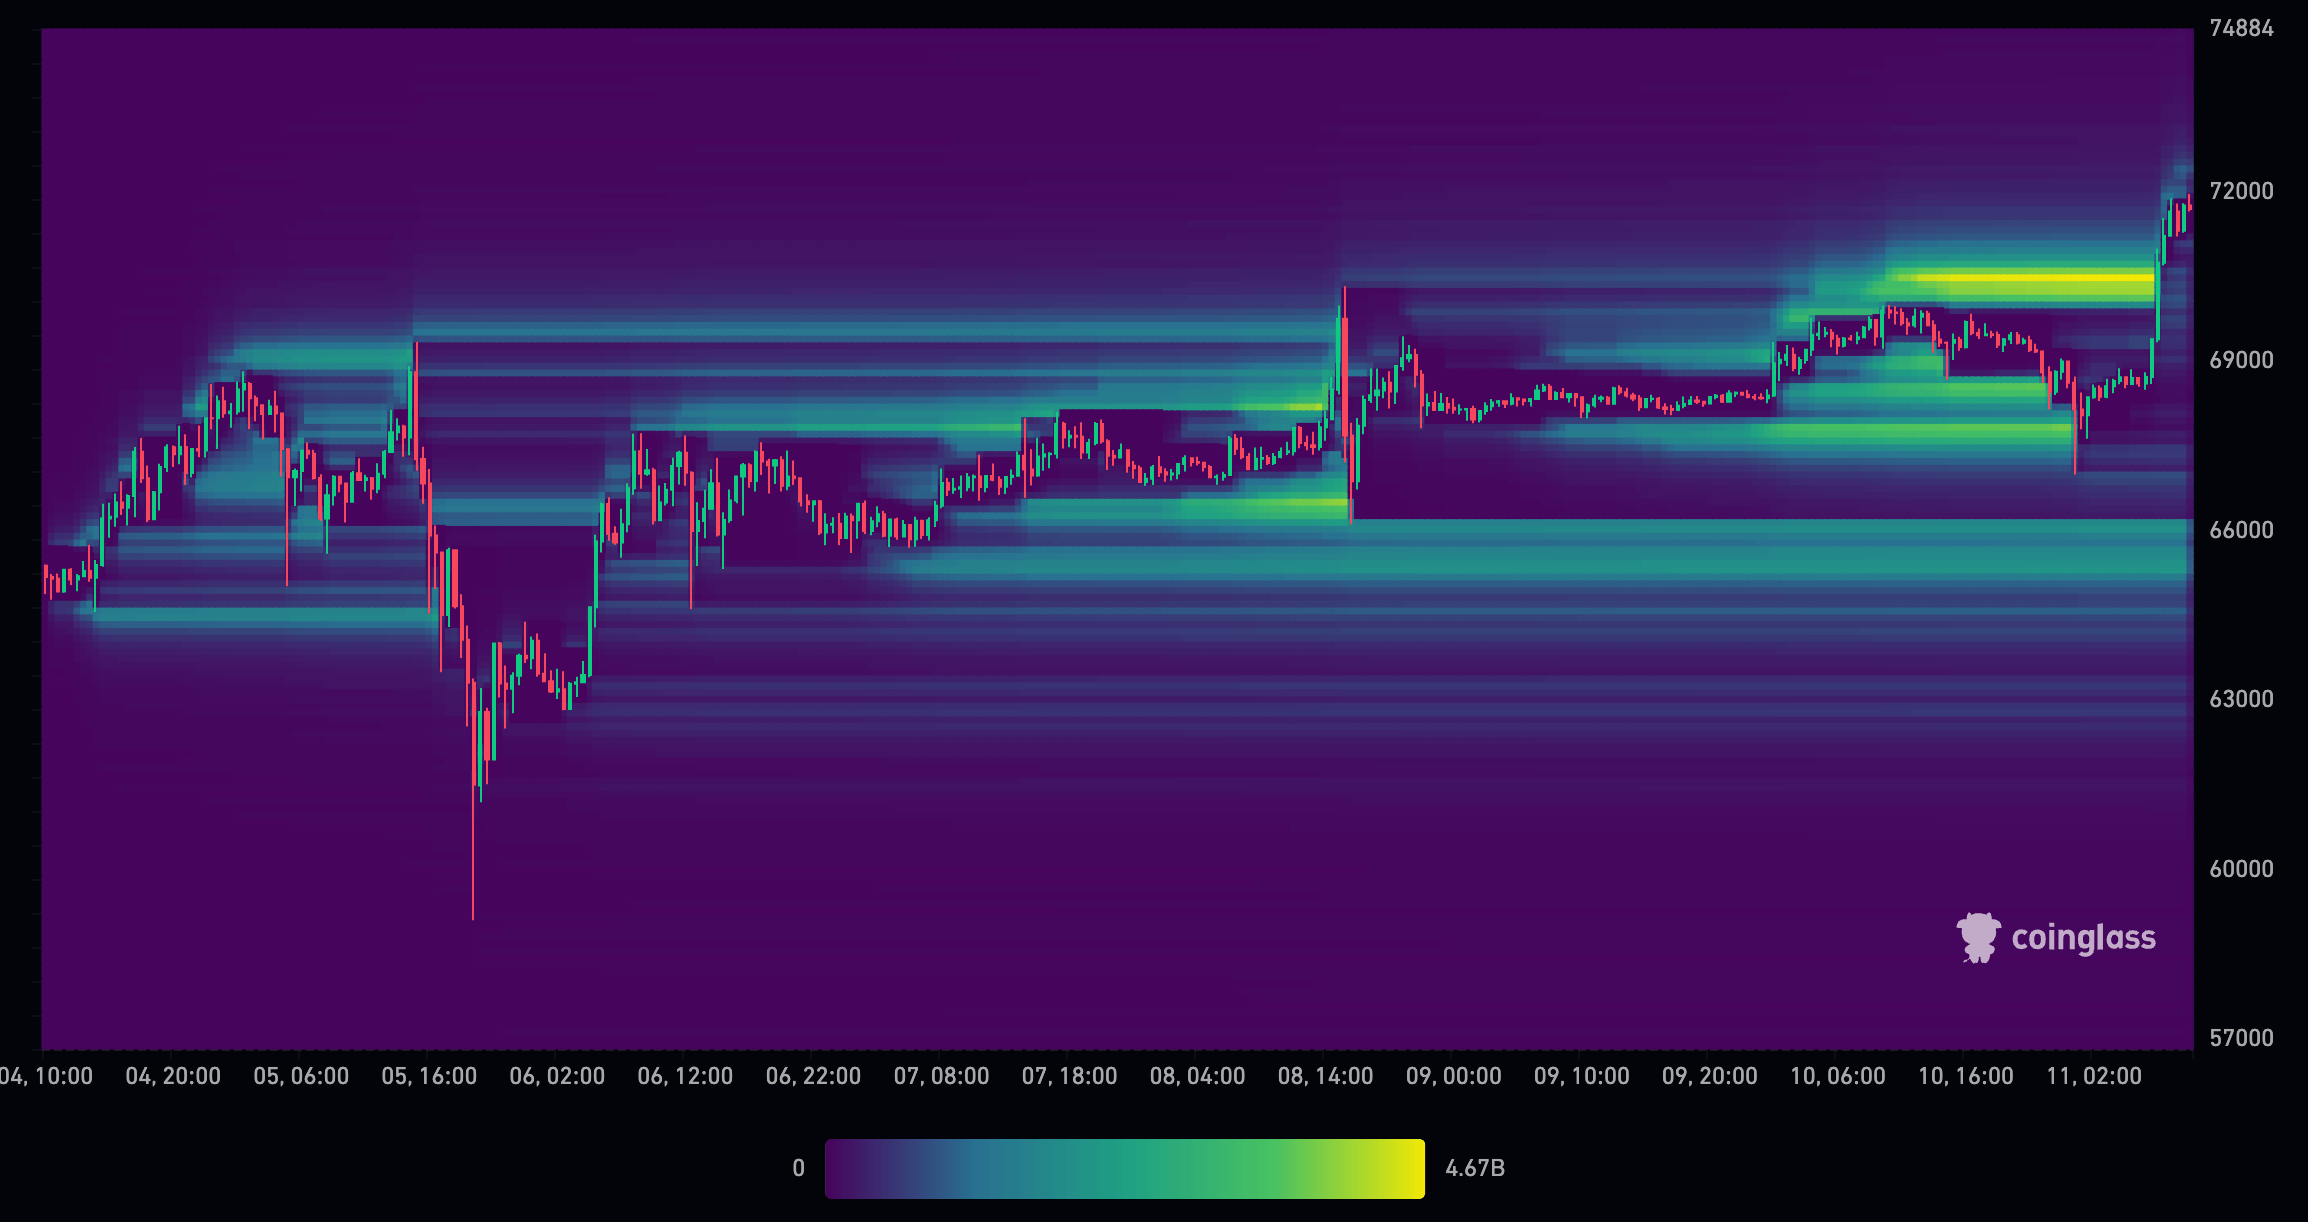
The liquidation chart from CoinGlass below highlights how trading activity on March 5 and 8 around 2.30 pm GMT (US market open) led to heavy liquidations of both long and short positions. A roughly 2% increase was followed by a decrease of over 10% on March 5, which swept the order books and flushed out all leverage down to $60,000.
The subsequent rapid V-shaped recovery saw further leverage positions created around $70,000 and $66,000. The market open on March 8 shook these out, leaving little to no leverage above $66,000.

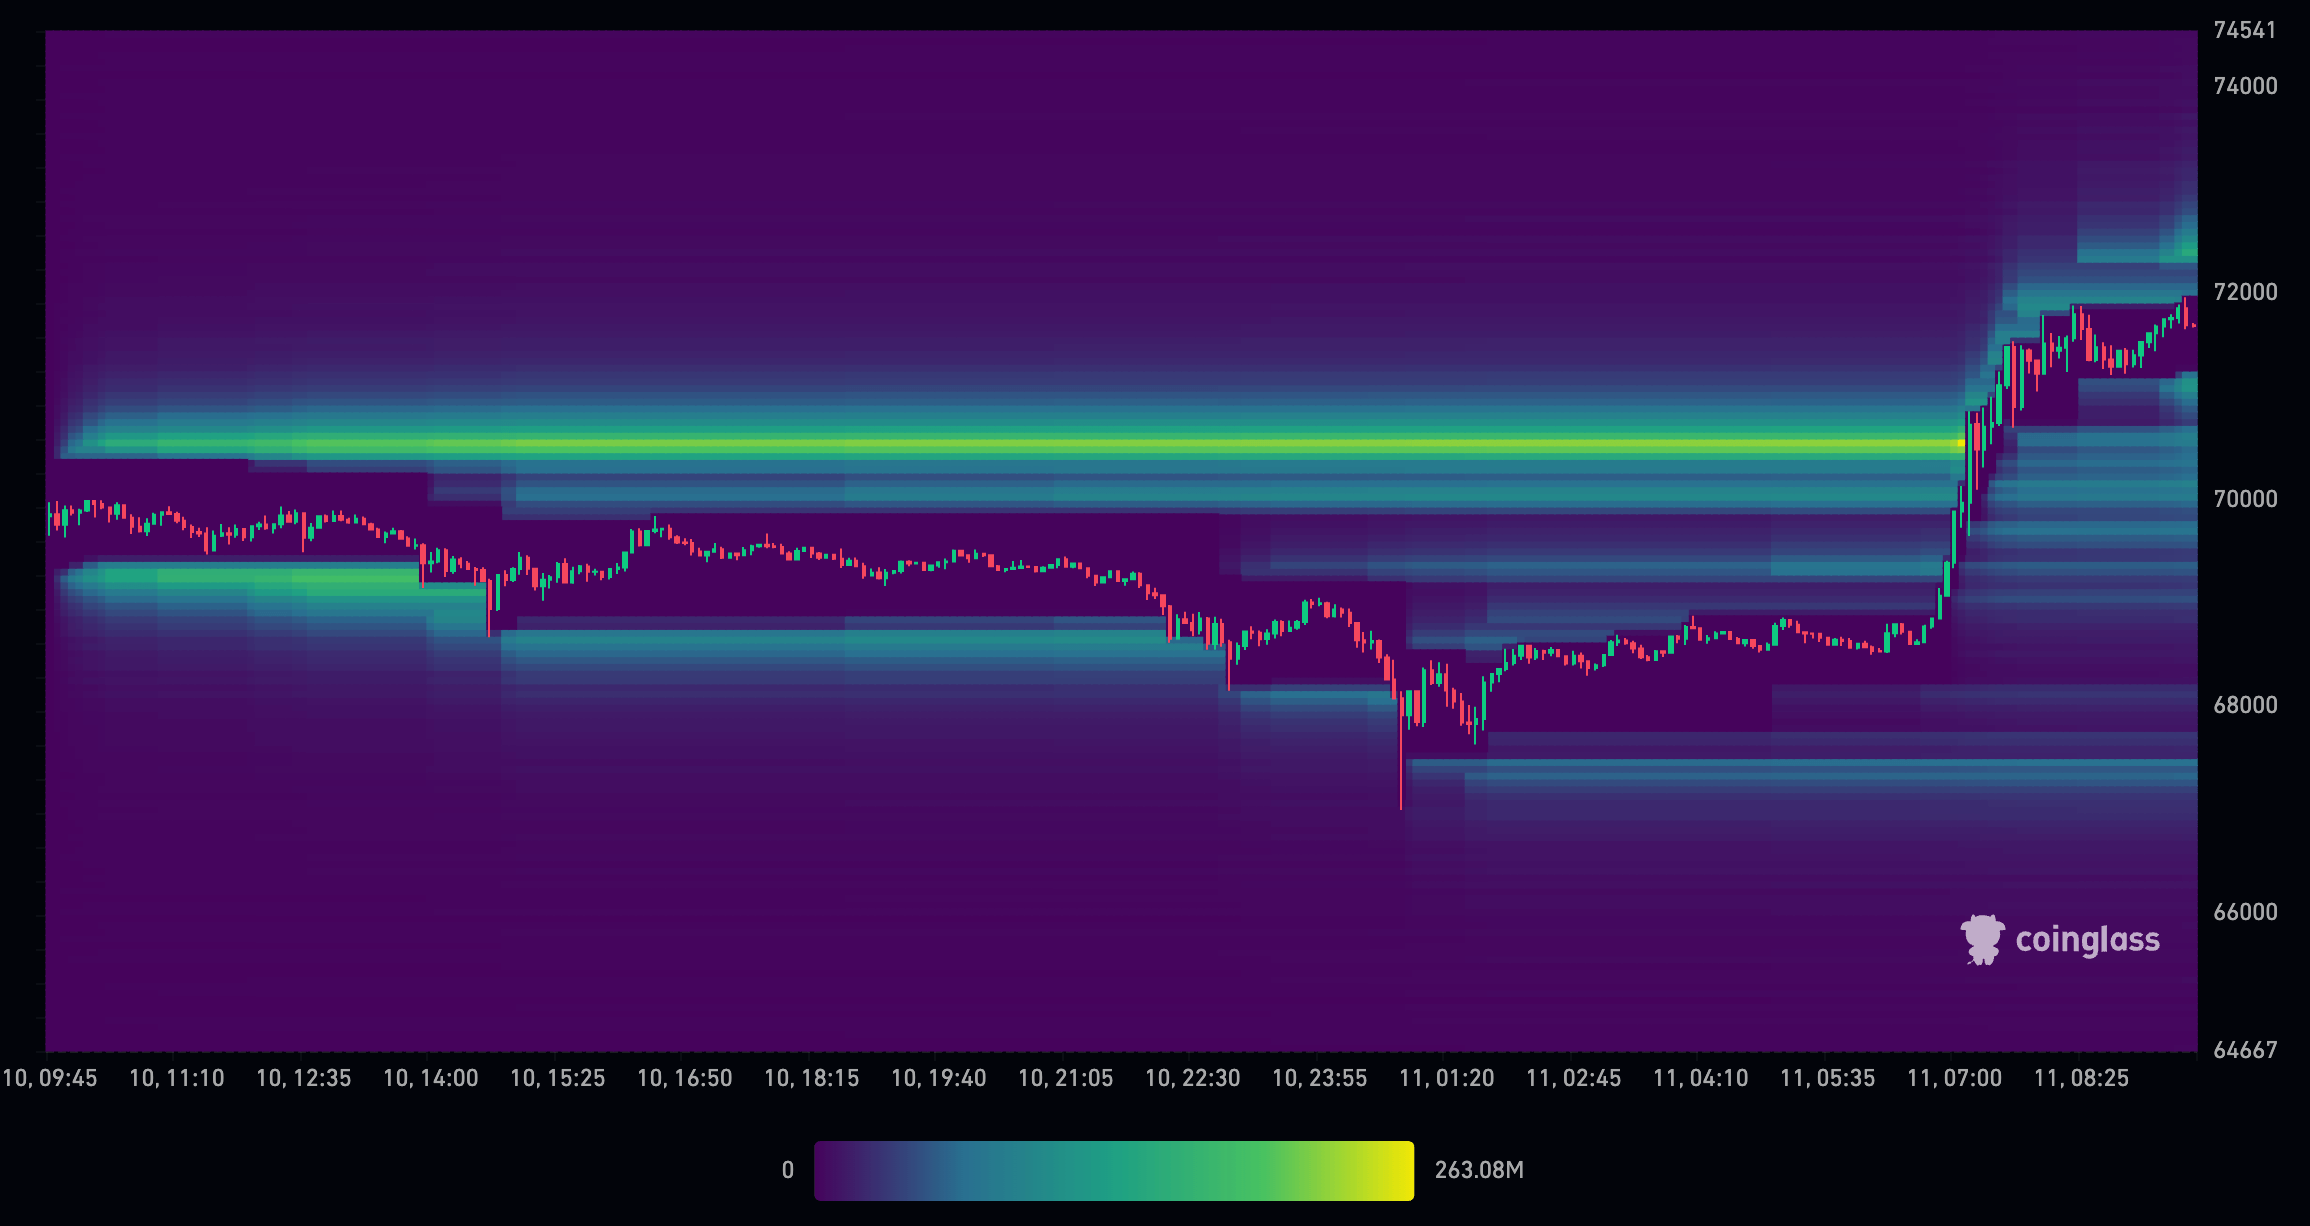
As of March 11, the drop to $67,000, followed by a surge to new highs around $71,500, has again removed most leveraged positions above $66,000, setting a solid floor. The effect of such movements is that Bitcoin now has free reign for natural price discovery above $66,000.
Unlike the bull market of 2021, which was heavily influenced by highly leveraged positions, the current cycle appears to be shaking out leverage before it has the chance to cause significant volatility. Further, key institutional players and market makers may have a hand in clearing the route for Bitcoin’s price discovery through large-scale trading activities.
The role of market makers in price discovery
Market makers and, more recently, ETF-authorized participants heavily influence financial markets, conducting the flow of buy and sell orders with precision, and are responsible for providing liquidity, which is the lifeblood of any asset’s market. By quoting continuous bid and ask prices, they aim to profit from the spread, but their role extends far beyond mere profit generation.
During periods of high volatility, market makers engage in a strategic maneuver known as “sweeping” the order book. This involves placing many orders at varying price levels to probe the market’s depth and ascertain the true balance of supply and demand. This sweeping action is a probe into the market’s present state and a catalyst for price discovery, revealing the levels at which market participants are willing to transact in significant volumes.
The recent sweep of leverage from the Bitcoin market has profoundly impacted price conditions. With the removal of leveraged sell orders, the market has witnessed a reduction in downward pressure, allowing for a more organic price discovery process. This is characterized by a market less influenced by the amplified bets of leveraged traders and more by its participant’s genuine sentiment and valuations.
As the market adjusts to the new equilibrium free from the weight of leveraged positions, the price of Bitcoin is more likely to reflect its actual market value. This is not to say that the path will be linear or devoid of volatility; the crypto market is known for its rapid price swings. However, the current landscape suggests the conditions are ripe for a more sustained upward trend.
Leverage reduction and order book sweeping since December
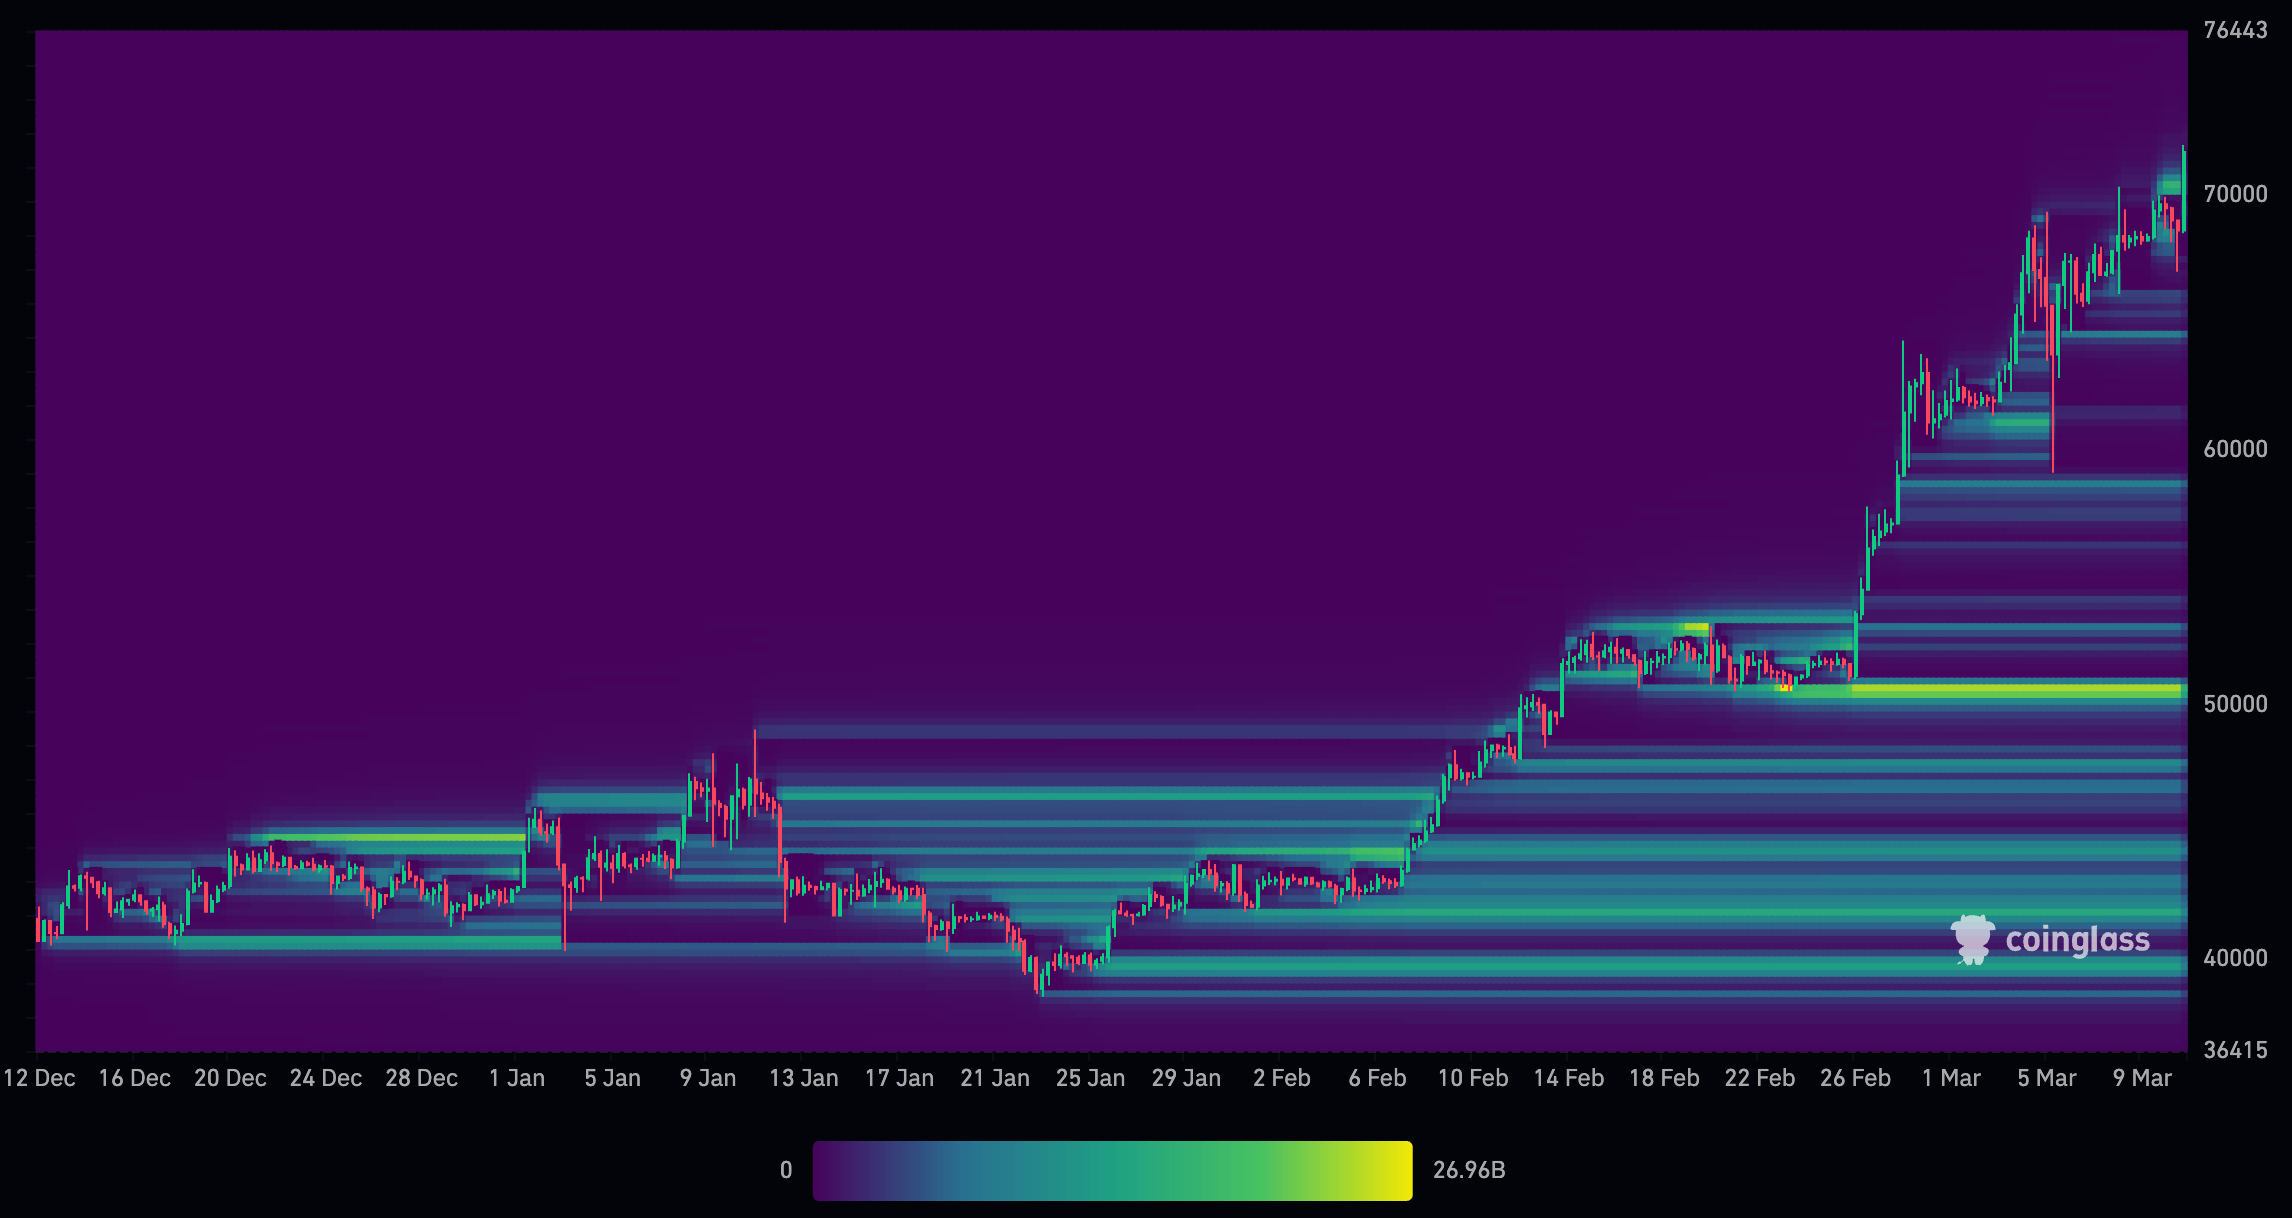
A closer look at the market forces from December 2022 to March 2023 explains the route for further price discovery and a new $50,000 floor.
In December, the market witnessed substantial liquidations of leveraged positions, with many longs liquidated just above the $41,000 level and shorts liquidated around $45,000. As Bitcoin approached the ETF approval on January 11, many shorts were opened around the $45,000 level, which persisted as the price dropped to around $40,000. Interestingly, there were not many longs at this level, suggesting that the price was supported by holders and general price discovery rather than leveraged positions.

As Bitcoin rebounded from $40,000 and climbed toward $45,000 by early February, several shorts were liquidated along the way. As Bitcoin continued its upward trajectory, longs were positioned from $40,000 to $50,000. By the time Bitcoin reached $50,000, there were substantial leveraged positions, amounting to approximately $27 billion. However, as the price increased, the amount of leveraged positions above $50,000 diminished considerably.
The price action at the beginning of March saw Bitcoin surge to $70,000 and then plummet to $59,000 within a single candlestick, effectively wiping out nearly all leveraged positions in the market. Although there was some leverage around $70,000, the majority of leveraged positions are now concentrated below $50,000.

The liquidation of leveraged positions has led to a more transparent market structure, with a more balanced distribution of longs and shorts. This development could pave the way for a more organic price discovery process driven by genuine market demand rather than leveraged speculation.
The recent liquidations and reduction of leveraged positions in the Bitcoin market suggest a potential shift towards a more fundamentally driven market. With the majority of leveraged positions now concentrated at lower price levels, there is room for the market to experience upward pressure as genuine demand and adoption drive prices higher.
Removing excessive leverage has set the stage for a healthier market dynamic, where price discovery is guided by fundamental factors such as increasing mainstream acceptance, regulatory clarity, and technological advancements in the blockchain space.
The recent liquidations and leverage data provide a compelling case for a potential upward trend driven by organic price discovery.

