Bitcoin (BTC) and Ethereum (ETH) prices have significantly increased in 2023, while XRP lagged behind.
The three cryptocurrencies’ price movements and indicator readings show distinctly different trends.
Are Cryptos at Risk of Reversal?
A recent post by Santiment noted that a large portion of the Bitcoin, Ethereum, and XRP supply is in profit. More specifically, over 80% of the entire supply is in profit.

Historically, the 55-75% region has been considered the average, while movements above and below this range are considered higher and lower risk, respectively.
Let’s look at the price movement for Bitcoin, Ethereum, and XRP and determine if a correction is in store.
Bitcoin Price Breaks Down From Pattern
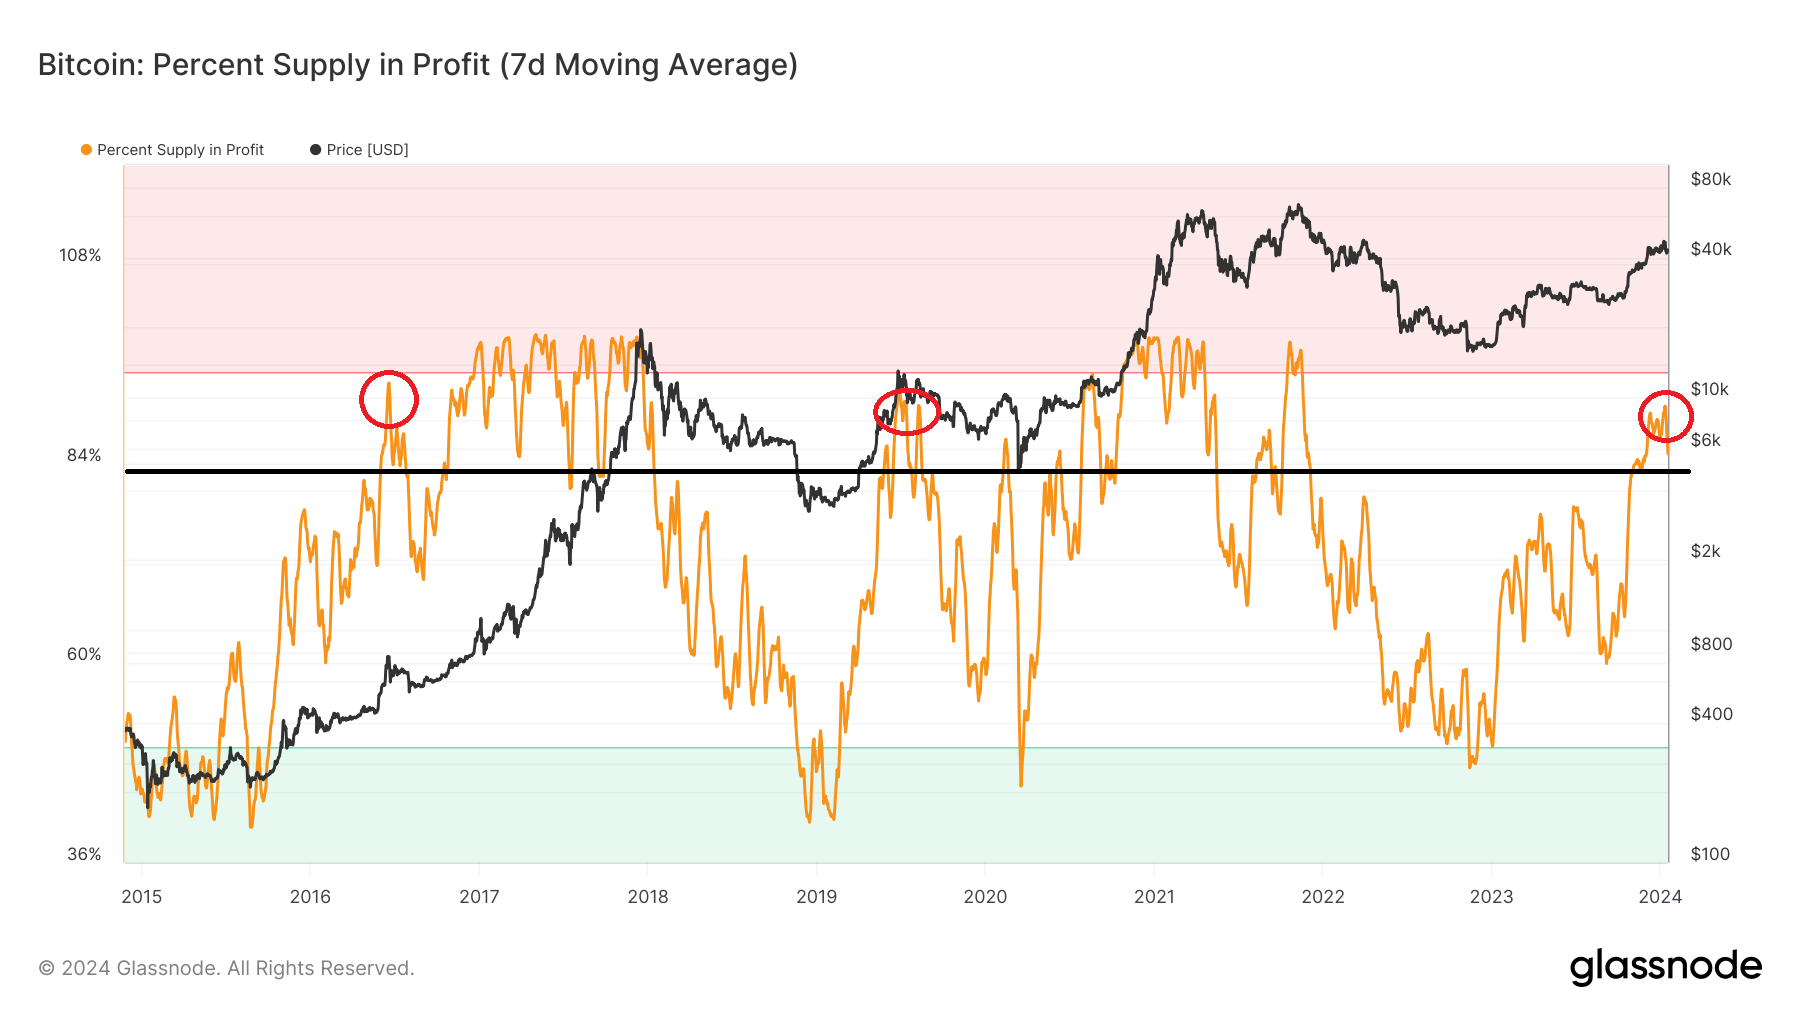
The Percent Supply in Profit (PSP) indicator notes the amount of the total supply that is in profit. Naturally, it approaches 100% once the price of an asset closes in on its all-time high and reaches 100% once it breaks its all-time high.
Currently, the PSP for Bitcoin is 85%.
Looking at the BTC price movement of the two previous market cycles, an interesting development reveals itself. More specifically, the first time PSP moved above 80 (black) after the bottom was followed by a significant correction.
This was visible in both 2014 and 2018 (red circle). Interestingly, PSP has moved above 80% after bottoming in 2022.

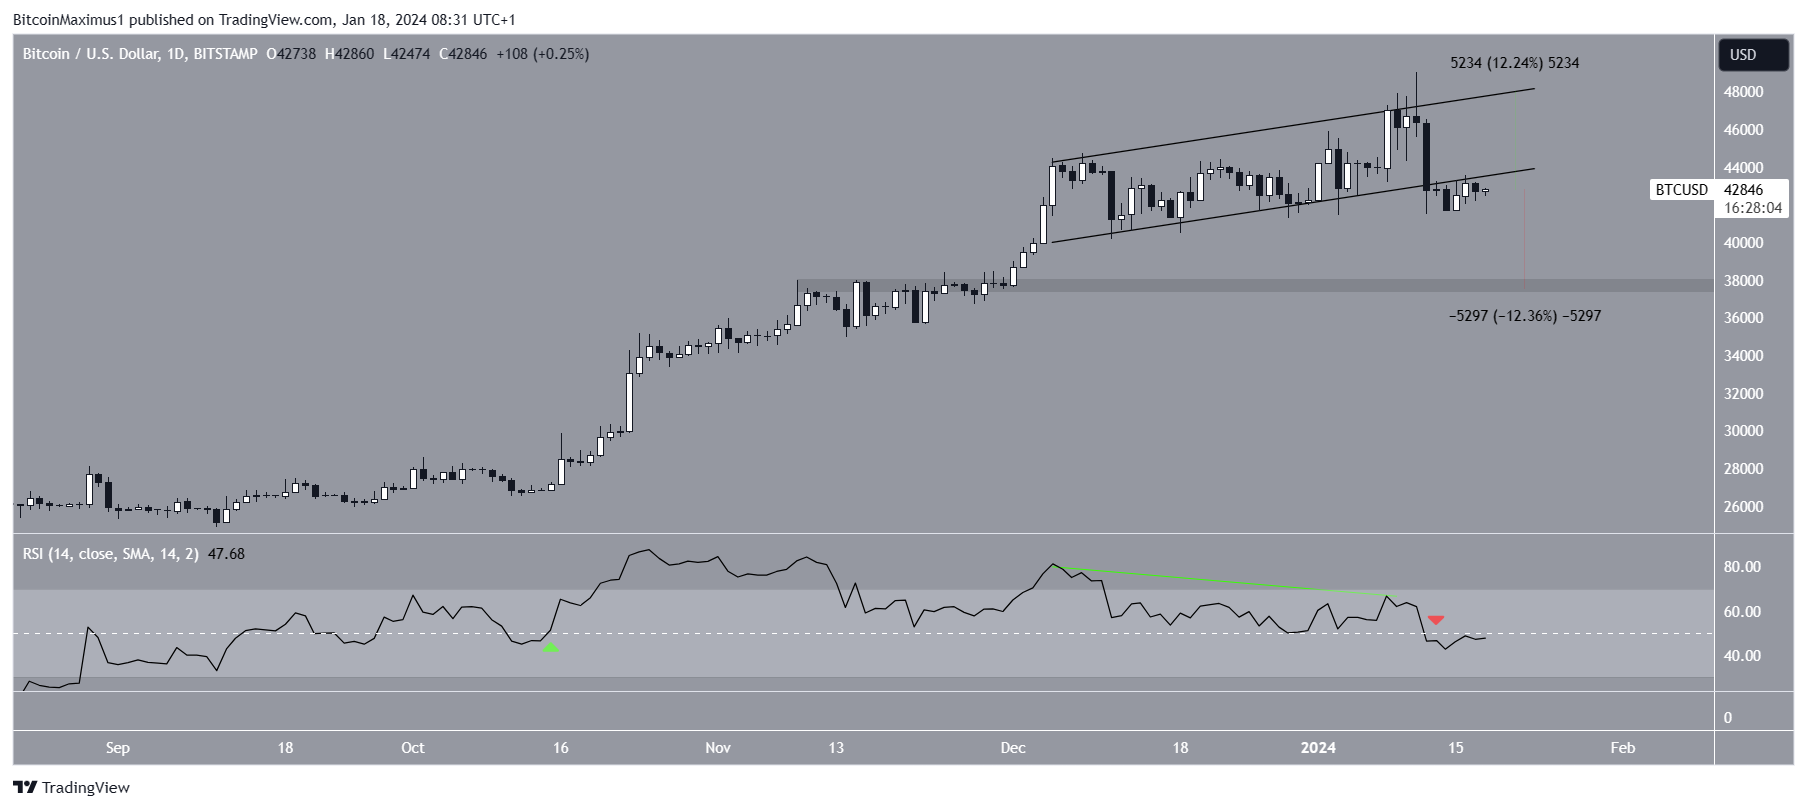
The BTC price action aligns with this bearish development. The daily time frame shows that BTC has fallen since reaching a high of $48,970 on January 11, 2024. The decrease caused a breakdown from an ascending parallel channel the next day. Bitcoin is validating the channel as resistance.
The daily RSI supports the breakdown. Traders utilize the RSI as a momentum indicator to assess whether a market is overbought or oversold. Bulls still have an advantage if the RSI reading is above 50 and the trend is upward. The opposite is true if the reading is below 50,
The daily RSI generated a bearish divergence (green) at the high. This occurs when a momentum decrease accompanies a price increase. Then, the RSI fell below 50 (red icon) for the first time since October 2023 (green icon). The signs suggest Bitcoin has reached a local top.
If the decrease continues, BTC can fall 12% to the closest support at $37,700.

Despite this bearish BTC price prediction, reclaiming the channel’s support trend line can trigger a 12% increase to the resistance at $48,000.
Ethereum Price Consolidates Above Resistance
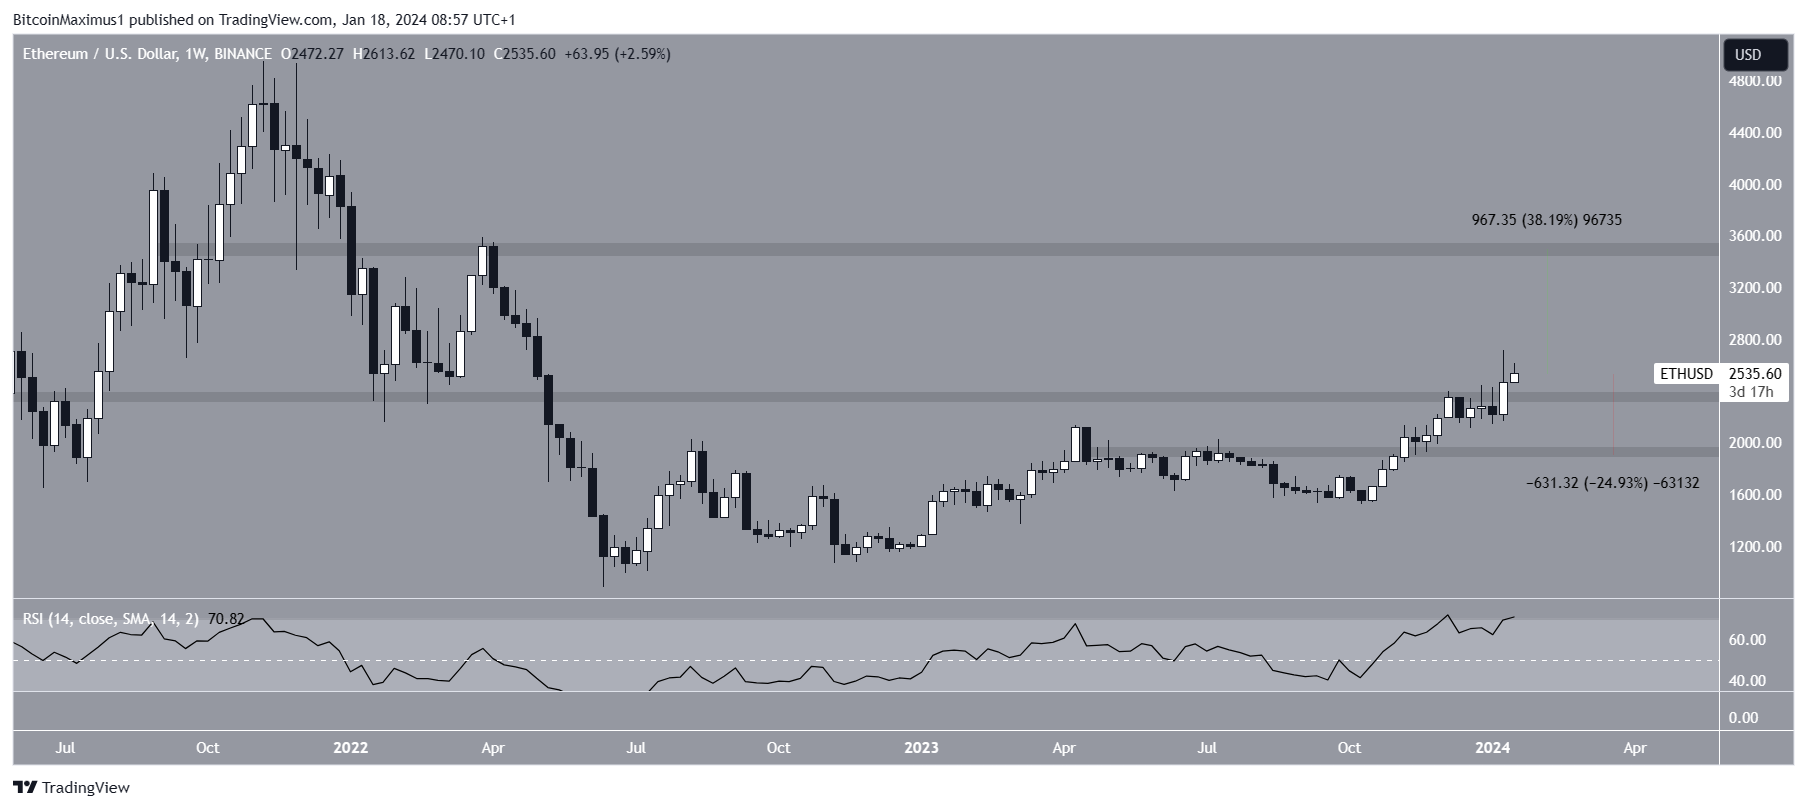
Unlike BTC, the price movement for ETH is not as bearish. This is because ETH broke out from the $2,350 horizontal area, which has sometimes acted as both support and resistance since May 2021. Moreover, the price reached a weekly close above this level.
Such a breakout above a pivotal resistance area is an extremely bullish development. The fact that the RSI is increasing and just moved into overbought territory legitimizes the upward movement.
If the increase continues, ETH can reach the next resistance at $3,500, nearly 40% above the current price.

Despite this bullish ETH price prediction, a close below $2,350 will invalidate the ongoing breakout. Then, the price can fall 25% to the closest support at $1,900.
XRP Hovers Below Resistance
While the BTC chart looks bearish and the ETH one bullish, XRP shows an undetermined trend. This is because of both the price action and RSI readings.
The price action shows that XRP has fallen under a descending resistance trend line since July. Recently, the trend line caused a rejection on December 28, 2023. The XRP price has not reached the trend line since.
While the price still trades above the $0.54 support, it has nearly returned to the level after a failed bounce. Additionally, the RSI is below 50. Whether the XRP price breaks down below $0.54 or breaks out from the trend line instead can determine the future trend.

A XRP breakdown can cause an 18% price drop to the closest support at $0.47, while a breakout from the trend line can initiate a 25% increase to the next resistance at $0.72.
For BeInCrypto’s latest crypto market analysis, click here.
Disclaimer
In line with the Trust Project guidelines, this price analysis article is for informational purposes only and should not be considered financial or investment advice. BeInCrypto is committed to accurate, unbiased reporting, but market conditions are subject to change without notice. Always conduct your own research and consult with a professional before making any financial decisions. Please note that our Terms and Conditions, Privacy Policy, and Disclaimers have been updated.

