On a sure-to-be historic day for Bitcoin, I spent the morning looking back at historical data to see how impactful the first Gold ETF was at the time. We’ve seen plenty of analysts, including our own, talk about how Gold ETFs changed the landscape for the commodity, leading to outsized gains over the proceeding 20 years. Yet, what was it really like at the time? Did gold explode on day one, or did it take time? Let’s dig in.
First, let’s look at the timeline of the relevant exchange-traded products we will look at.
On Nov. 18, 2004, State Street Corporation launched SPDR Gold Shares (GLD), acquiring $114,920,000 in assets under management on launch and $1 billion in its first three trading days.
On Oct. 19, 2021, ProShares launched ProShares Bitcoin Strategy ETF (BITO), which had $570 million in inflows on day one, hitting $1 billion in assets the next day.
On Jan. 11, 2024, eleven spot Bitcoin ETFs will launch in the U.S. with $115.88 million under management via the sponsors’ seed funds. This means once they’ve taken $115 million in inflows, issuers like BlackRock, Ark, VanEck, and company will buy Bitcoin from the open market via Coinbase and Gemini, just like the rest of us.
Thus, before trading commences (removing Grayscale, which is converting its trust* into an ETF that already has $28.58 billion in AUM), the combined spot Bitcoin ETFs will have surpassed GLD’s day one trading. If we include Grayscale, spot Bitcoin ETFs have more assets under management than gold did for the first five years. GLD didn’t garner $29 billion in AUM until Feb. 12, 2009.
However, to be fair, it was no longer the only gold ETF by this point. BlackRock launched its iShares® COMEX® Gold Trust in 2005. Combined with GLD, gold ETFs reached an equivalent AUM around Feb. 10, 2009, with IAU obtaining $2 billion in assets by the end of Q1 2009.
By the end of 2009, three gold-backed ETFs were traded in the United States: ETFS Physical Swiss Gold Shares, SPDR Gold Shares, and iShares Comex Gold Trust.
| Company | Seed Investment ($M) |
|---|---|
| Bitwise | 20 |
| VanEck | 72.50 |
| Valkyrie | 0.52 |
| Franklin Templeton | 2.60 |
| WisdomTree | 4.95 |
| Invesco Galaxy | 4.85 |
| BlackRock | 10 |
| Ark | 0.46 |
| Grayscale | 2,858 |
How did GLD trade at launch?
The first gold ETF was launched in the U.S. on Nov. 18, 2004, and within 12 days, the price of gold was up just 2.82%.
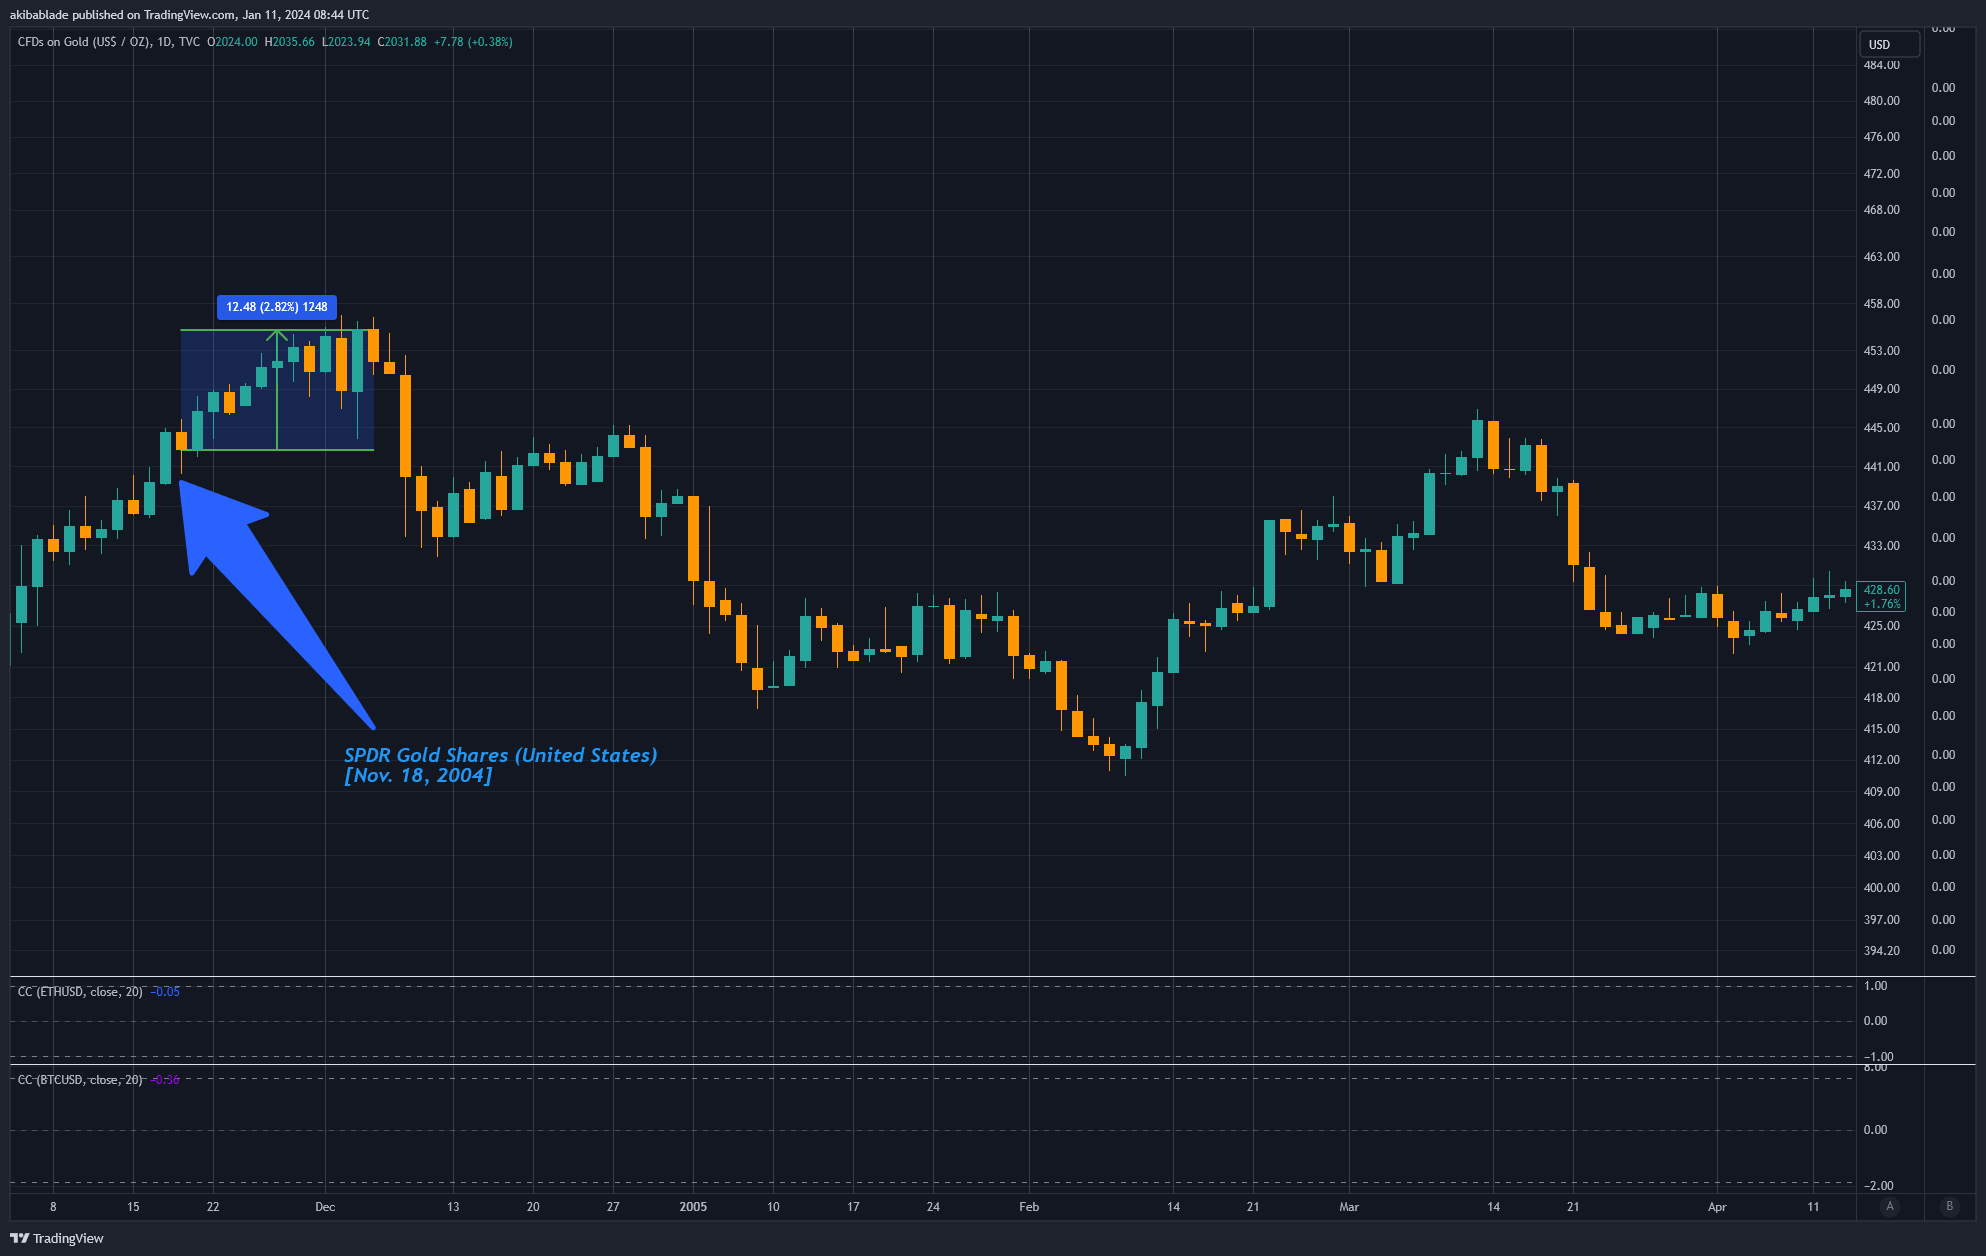
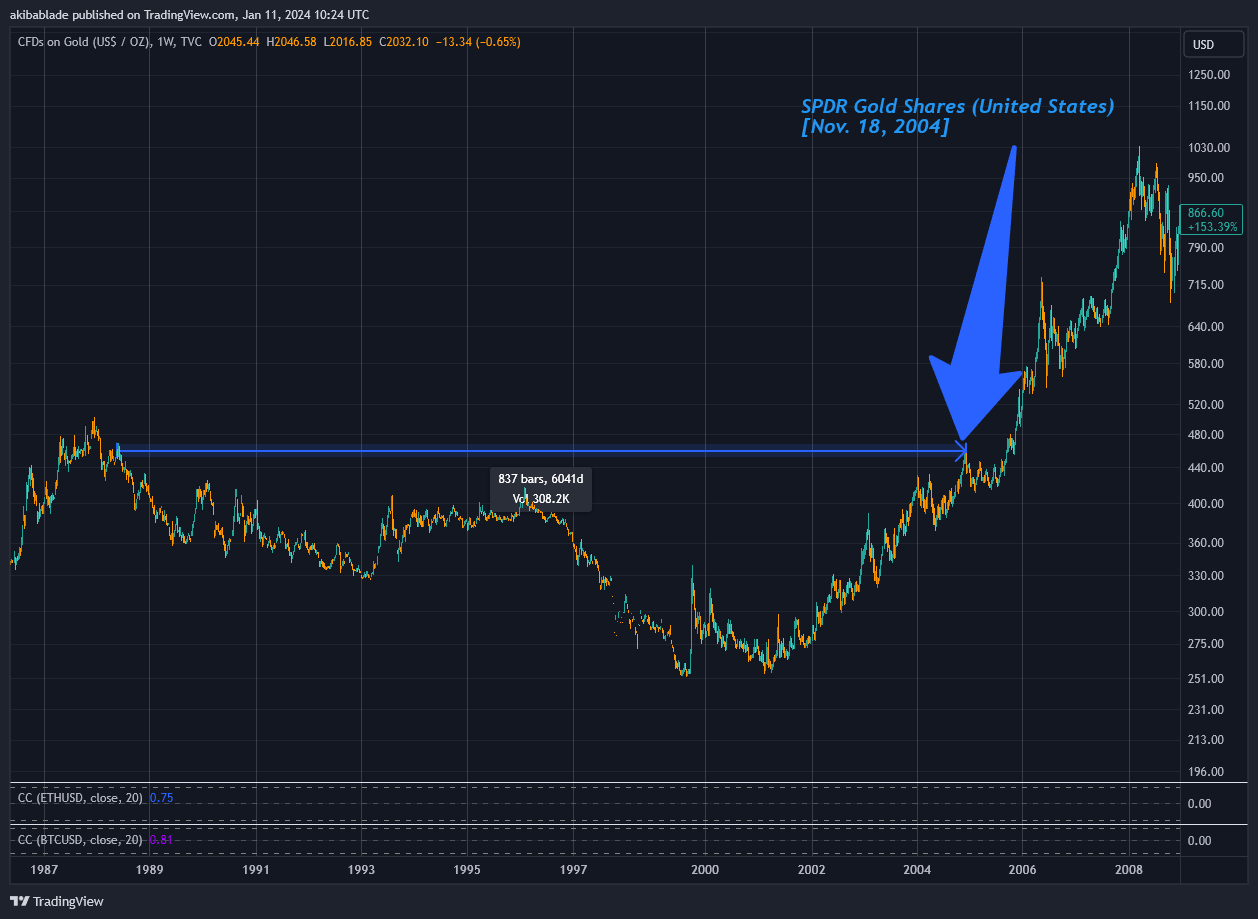
This marked a sixteen-year high for gold, which had not reached $453 per ounce since May 1988. However, it was not at an all-time high. In fact, it would take another four years before that would occur.
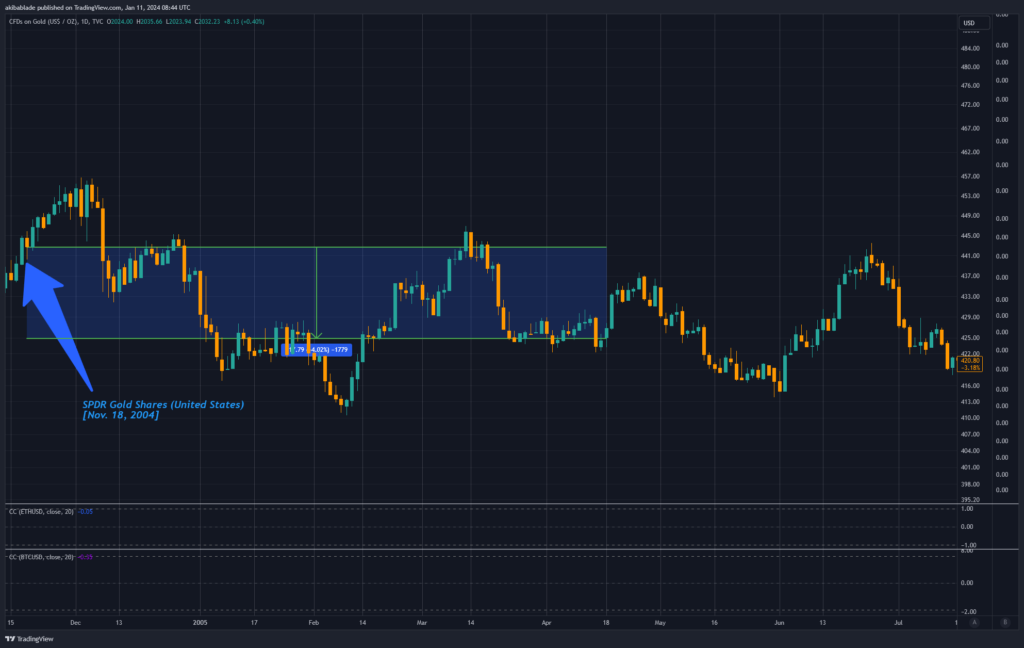
Following the local high in Dec. 2004 at $453.40, gold went on a prolonged downward trajectory, with the price down 4% over the next six months. On its sixth-month birthday, GLD had acquired $2.4 billion in assets under management, with gold priced at $419.75.
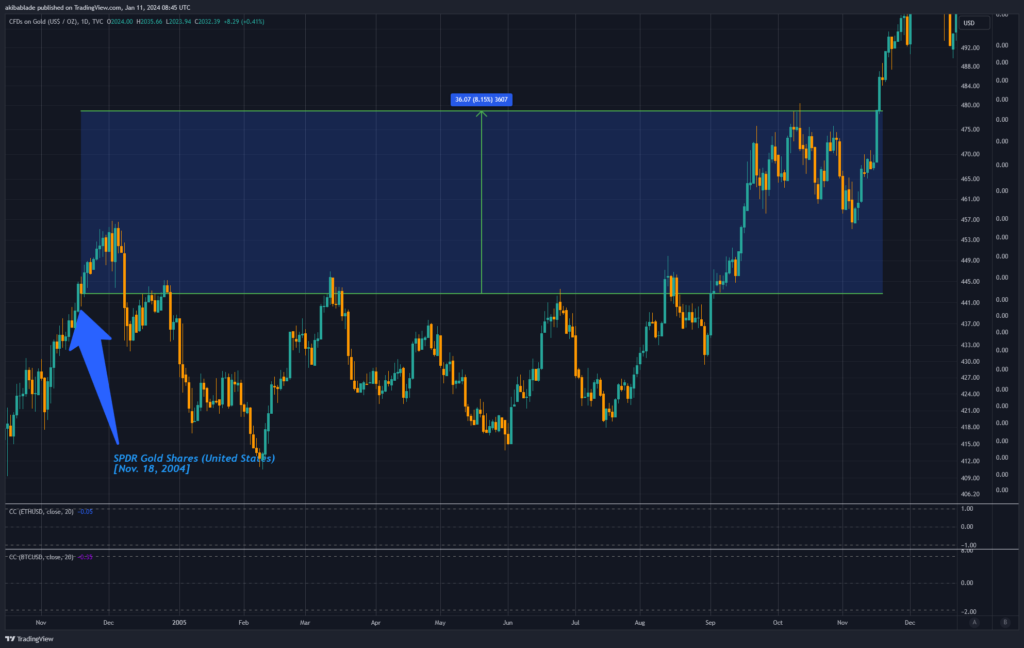
However, things started to get much better for the flagship commodity. By Nov. 2004, on the anniversary of its launch, gold had risen to $485,85, up 8.15% since launch. Thus, gold was up less than Bitcoin after a year and could swing on a Gary Gensler tweet. Far from the earth-shattering impact many predict from the comparison to the gold ETF launch.
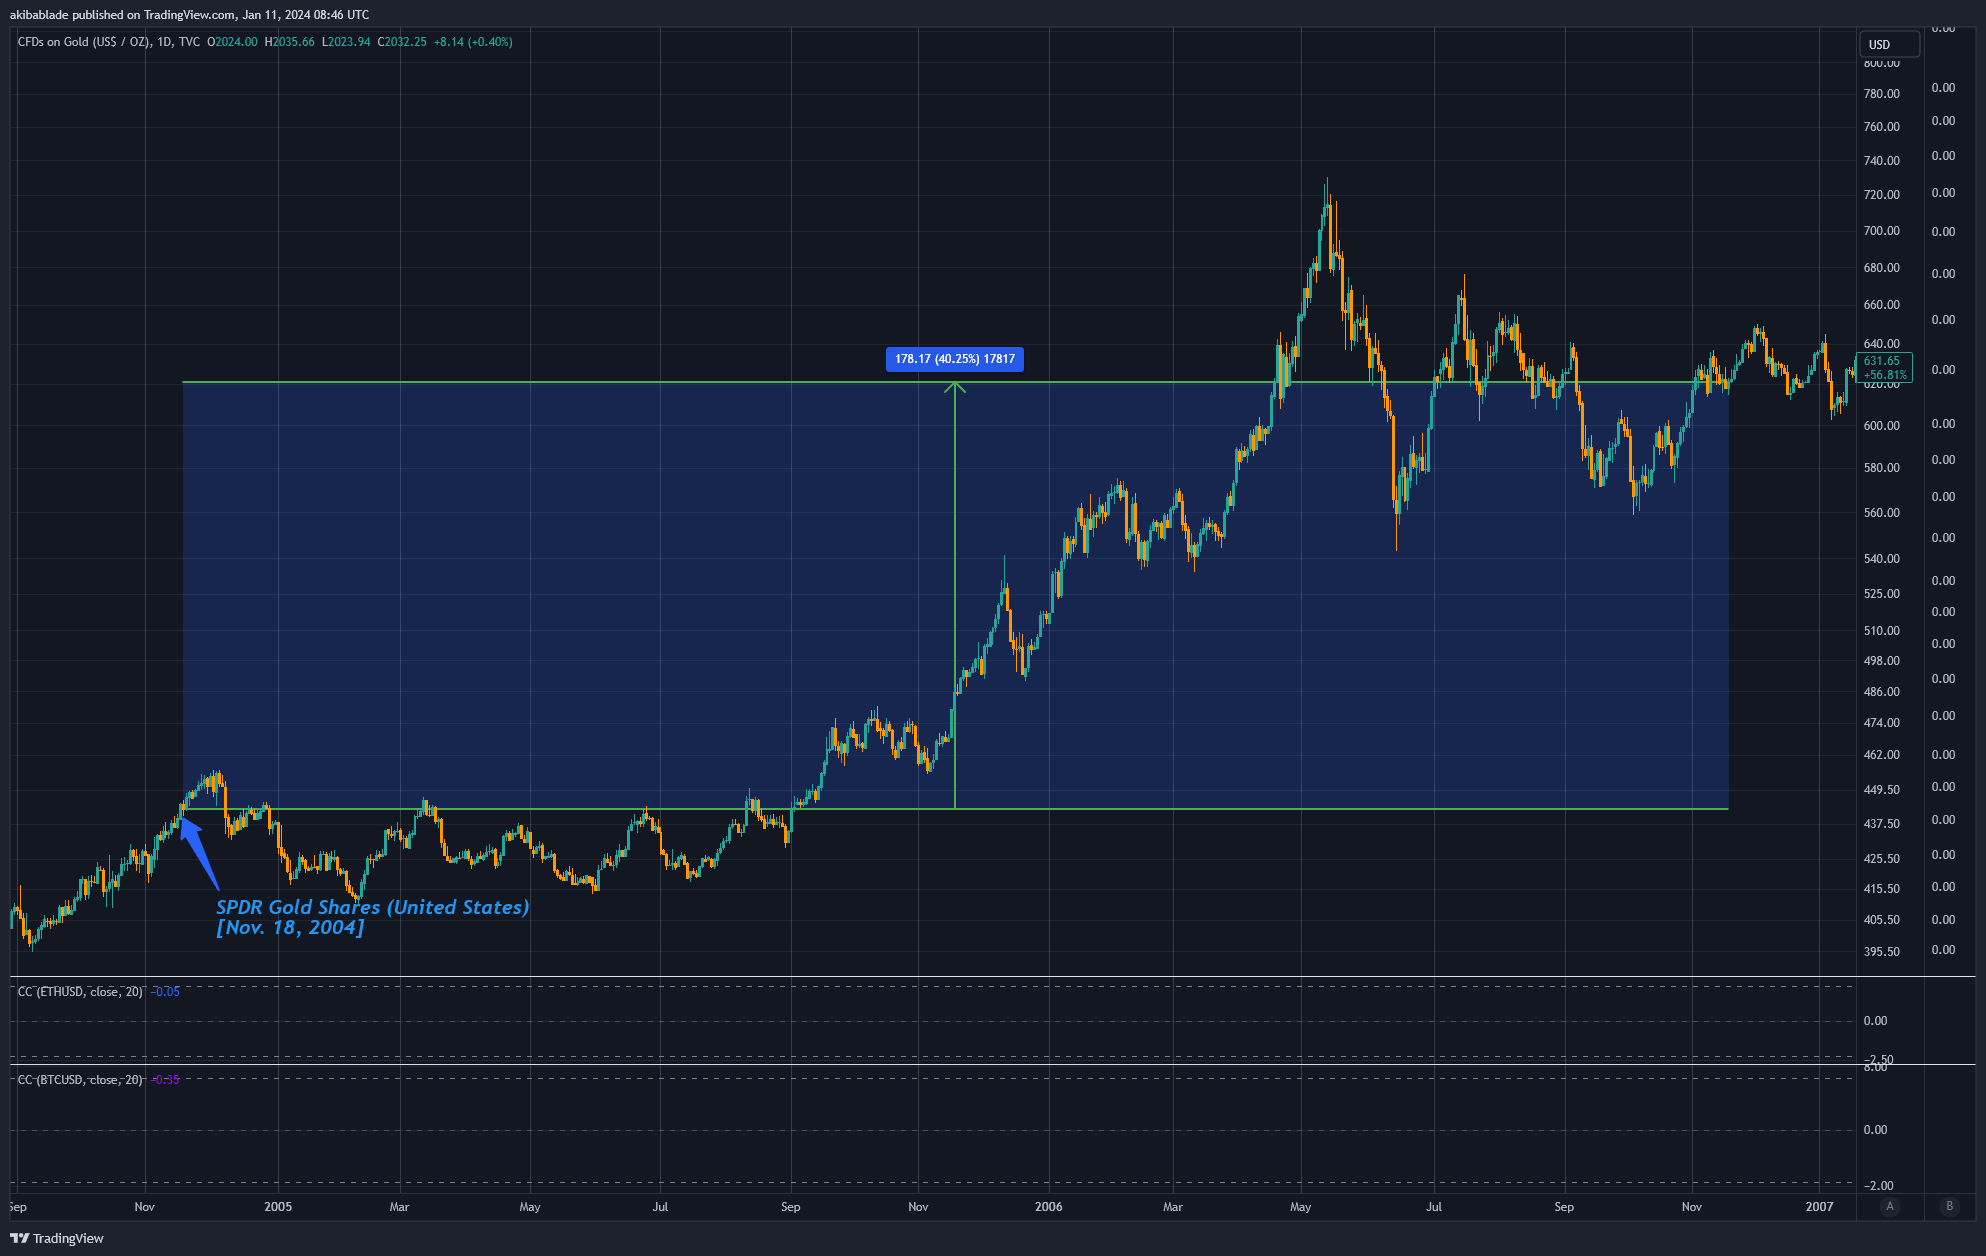
As GLD turned 2 on Nov. 18, 2006, gold was up to $620.50, an increase of around 40%.
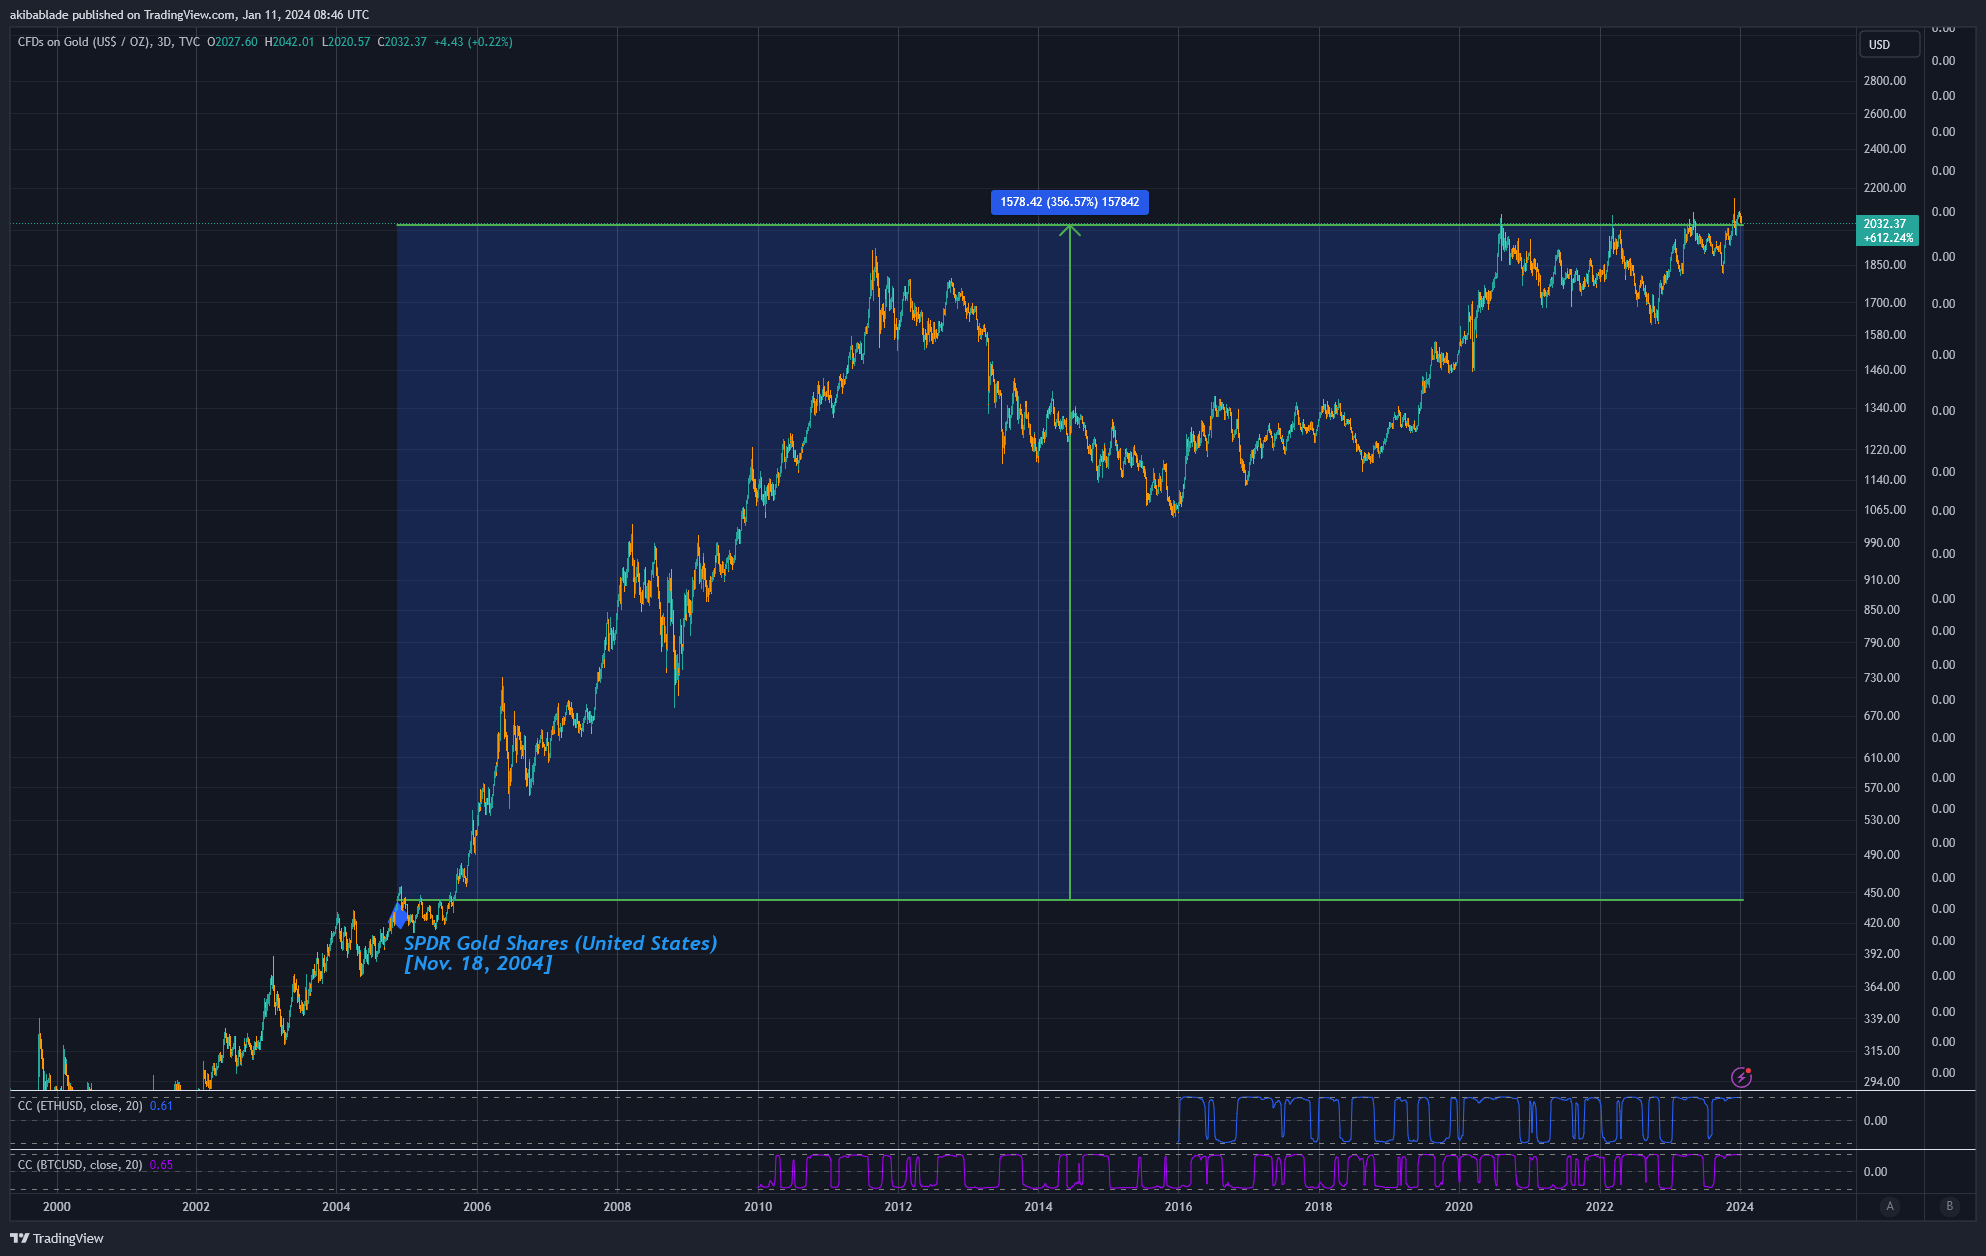
Today, gold is priced at around $2,032 as of press time and a staggering 356%. However, that is on a nearly 20-year timeframe. By comparison, were Bitcoin priced at $210,000 on Jan. 11, 2044, how many investors would be happy with that return? Following gold’s trajectory, that’s the price point we’d be looking at.
However, gold and Bitcoin are like comparing apples with oranges. While we may discuss Bitcoin as digital gold, it is undoubtedly much more.
Let’s start by looking at gold in relation to the M2 money supply in the U.S. M2 is a broad measure of the money supply. It includes all components of M1 (notes and coins, checking accounts, other checkable deposits, traveler’s checks) plus savings deposits, small-denomination time deposits (time deposits in amounts of less than $100,000), and balances in retail money market funds.
M2 only excludes large deposits, institutional money market funds, short-term repurchase agreements, and other more considerable liquid assets, making it a relevant long-term metric to assess the spending power of the U.S. dollar.
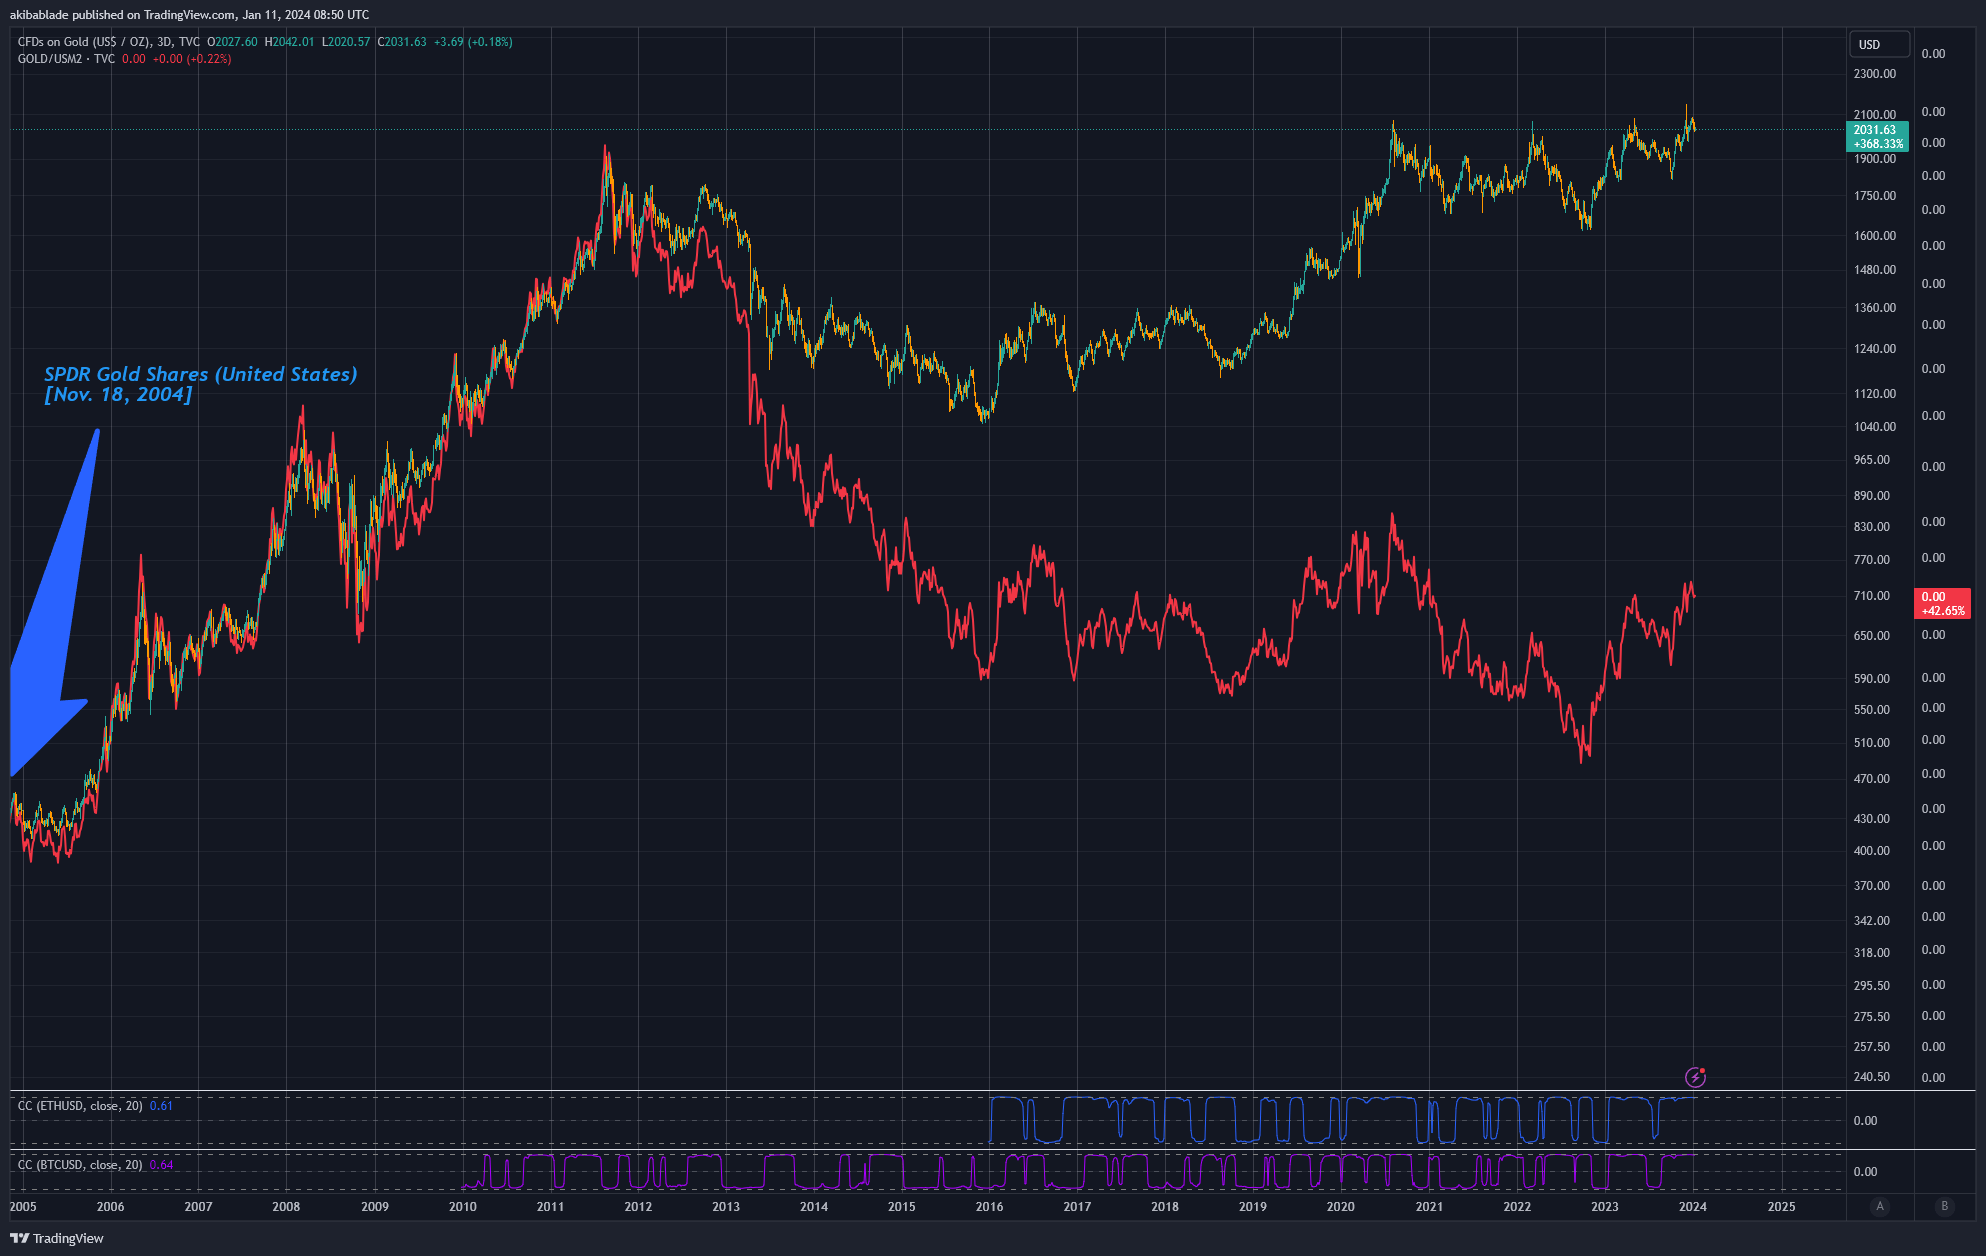
When adjusted for the M2 supply, gold is up just 42%. Gold followed Gold/M2 pretty tightly from 2004 until 2012, and while the dollar price of gold continued to rise, Gold/M2 has been on a downtrend ever since.
Comparisons with Bitcoin
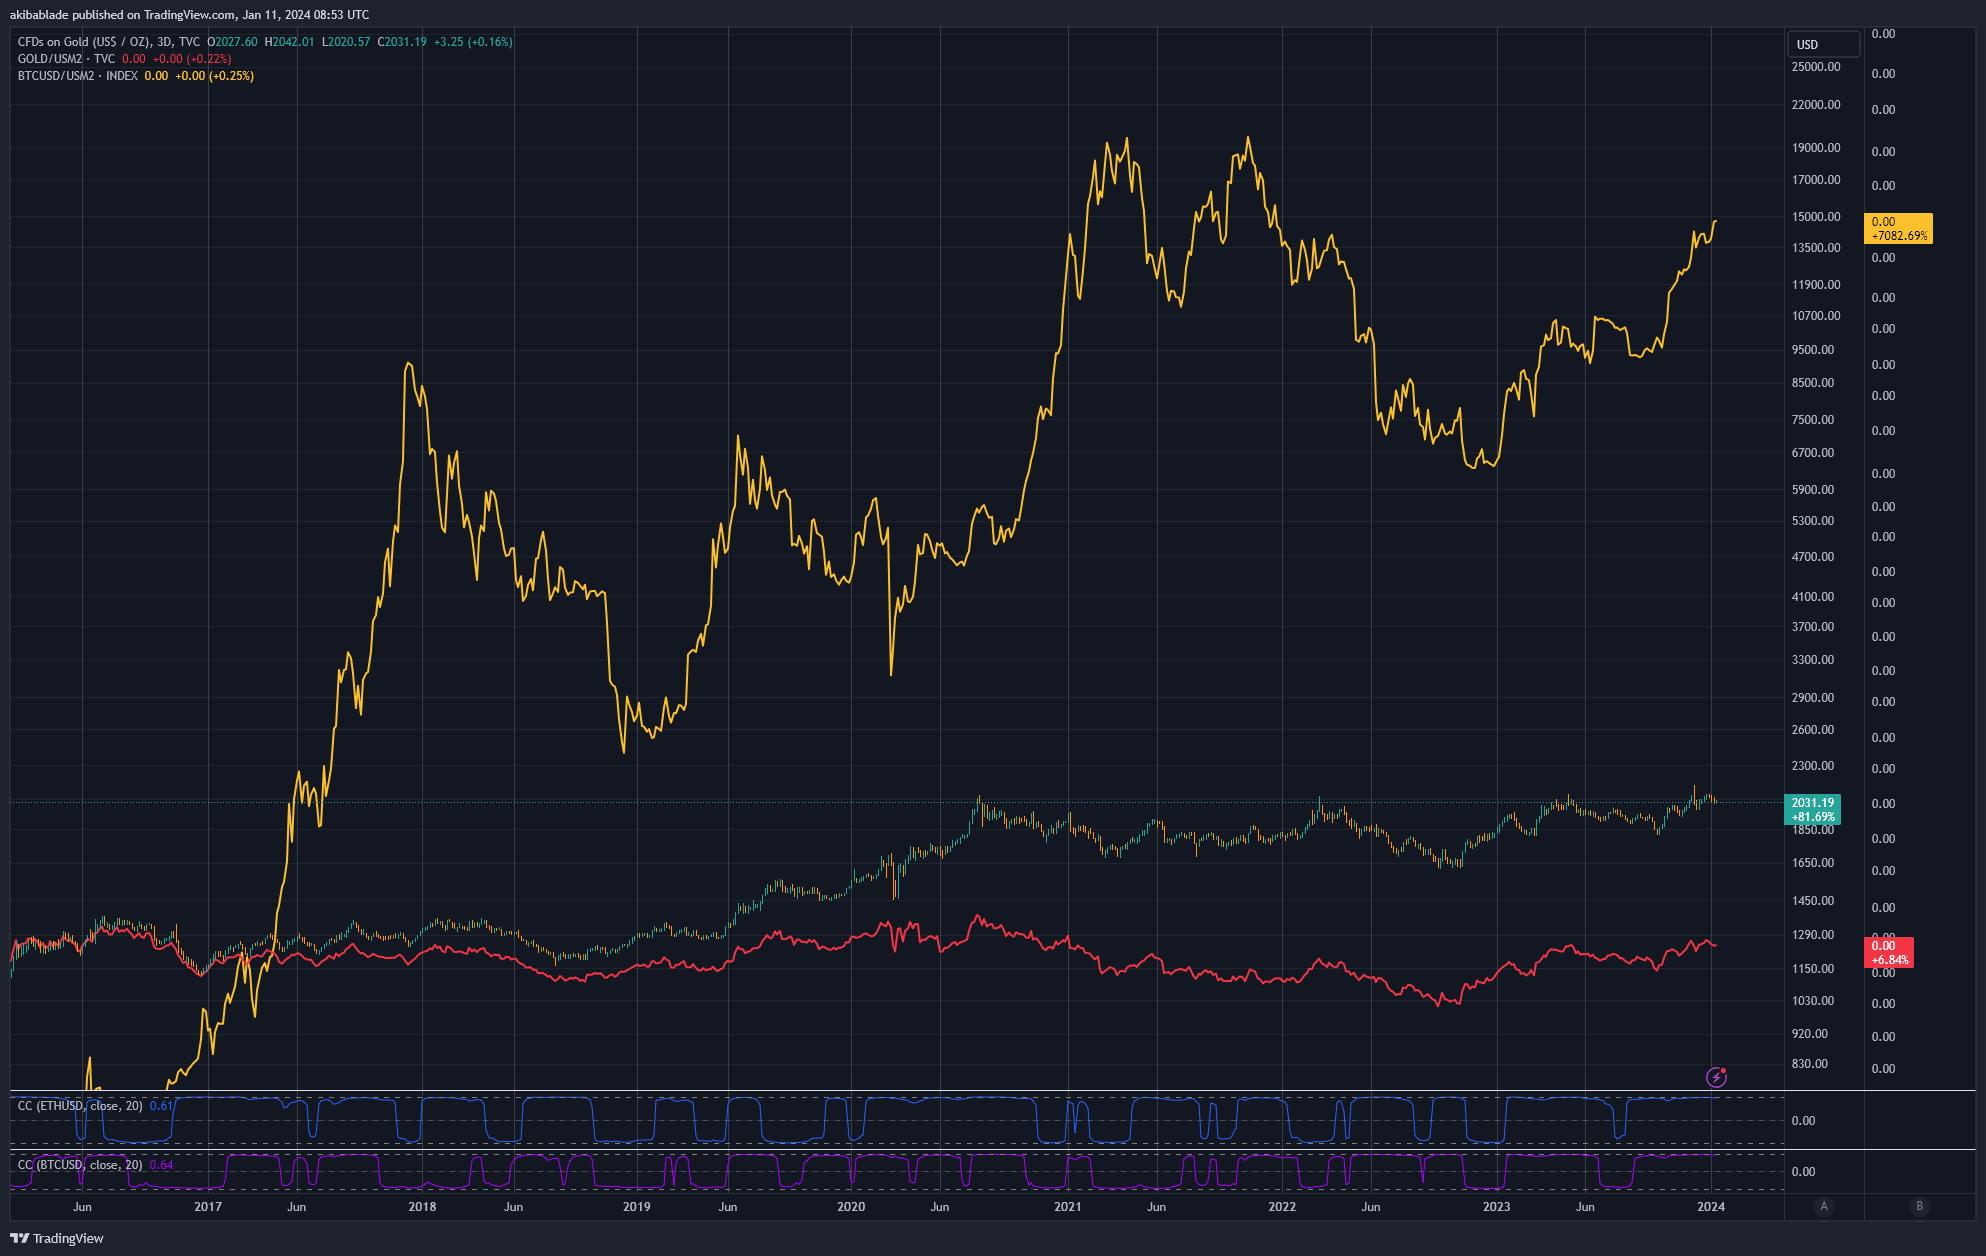
As we can’t compare Bitcoin over the same period as it was not launched until 2009, and its price discovery was highly volatile during its early days, I’ve used 2015 – 2024 in the chart below to compare Gold/M2 to Bitcoin/M2.
As you can see, Bitcoin has performed significantly better than gold (7,082%) over the past decade, even accounting for the 70% increase in the number of dollars included in the M2 supply.
However, not only has Bitcoin shown to increase even against dollar dilution, but it also has a fixed supply and tight market dynamics. Only 30% of all Bitcoin in circulation has been traded within the past 12 months.
Bitcoin’s supply is capped at 21 million coins, making it fundamentally scarce. This scarcity is a crucial driver of its value, akin to precious metals like gold. However, Bitcoin’s supply is predictably finite, unlike gold, where new reserves can be discovered and mined. The introduction of the spot Bitcoin ETFs is likely to amplify the scarcity effect.
As more investors buy into the ETF, a portion of Bitcoin’s limited supply will be locked up to back these investment products, reducing the available supply for regular trading on open markets. This decreased supply could lead to price appreciation, especially in the face of increasing demand (often spurred by easier access through financial products like ETFs). There is also a cyclical effect here whereby ETF issuers must fill baskets of shares with Bitcoin from the open market.
Moreover, the fact that 70% of the current circulating supply of Bitcoin hasn’t moved in over a year indicates a robust holding behavior among current Bitcoin owners. This holding pattern reduces the effective circulation of Bitcoin, further enhancing its scarcity.
When long-term holders hold a significant portion of an asset, any increase in demand, such as that generated by the launch of a new investment vehicle like the spot Bitcoin ETFs, can have a disproportionate effect on the price. There’s less supply available to meet this new demand.
This behavior contrasts with gold, where holding patterns are more diverse and include significant industrial and jewelry use, which can dampen the scarcity-driven price appreciation seen in assets like Bitcoin.
Thus, while gold has seen exceedingly solid gains over the past 20 years, comparing its ETF-fueled growth to Bitcoin may, in reality, be exceedingly underwhelming.
It’s important to note that demand for Bitcoin in relation to its scarcity still has to correlate to its demand at the asking price. It’s unlikely that Bitcoin will have the same demand at $1 million per coin as it would at $1 per coin, for instance. In my view, this is where the rubber meets the road; at what price does the demand for Bitcoin change?
Digging into the numbers – Bitcoin vs gold AUM
Yesterday, Bitcoin traded $52 billion across all exchanges at around $45,000 – $47,000.
Around 6.2 million BTC are in the market (they moved within the past 12 months). Glassnode estimates around 7.9 million coins have been lost or are unlikely to move any time soon. Given the current circulating supply of around 19.59 million, we can thus estimate a liquid pool of between 6.2 and 11.6 million coins available for purchase.
At today’s value, this equates to around $291 to $545 billion in liquid coins in the market, or around ten times the daily volume traded.
Thus, hypothetically, each of the 11 spot Bitcoin ETFs launching today would need to acquire around $49 billion in AUM to eat up the entire theoretical liquidity in the market.
As of Jan. 10, 2024, the top gold ETF, GLD, has an AUM of $56 billion. Assessing the overall top ETFs, SPY has $483 billion, and IVV has $396 billion.
The total value of assets under management for all gold ETFs in the U.S. is around $114 billion.
Thus, there is certainly room in the market for spot Bitcoin ETFs to acquire currently liquid coins, but it is still a tight market, and in less than 100 days, it will become even tighter.
When analysts compare the success of a spot gold launch 20 years ago with the potential for Bitcoin to follow suit, I think they may be drastically underestimating the differences between gold and ‘digital gold.’
Putting it into context, if BlackRock acquires the same AUM in Bitcoin as it has in gold (roughly $27 billion,) it would be 5% to 9% of all liquid Bitcoin on the market. Moreover, there are currently 2.35 million BTC on exchanges. So it would need to purchase 24% of exchange-listed Bitcoin… at current prices, that is.
Drawing on the parallels and contrasts between the historical impact of Gold ETFs and the potential influence of the upcoming spot Bitcoin ETFs, it becomes evident that while the success of Gold ETFs was significant, the unique attributes of Bitcoin, such as its fixed supply and prevailing holding patterns, could lead to an even more profound impact on the market, accentuating the potential for a transformative effect far beyond what was observed with gold.

