The deadline for approving the Bitcoin (BTC) Exchange-Traded Fund (ETF) is January 10. The BTC price began an upward movement yesterday.
Today, Bitcoin moved above $47,000 for the first time since March 2022. Can it continue to $50,000?
Bitcoin Moves Above $47,000
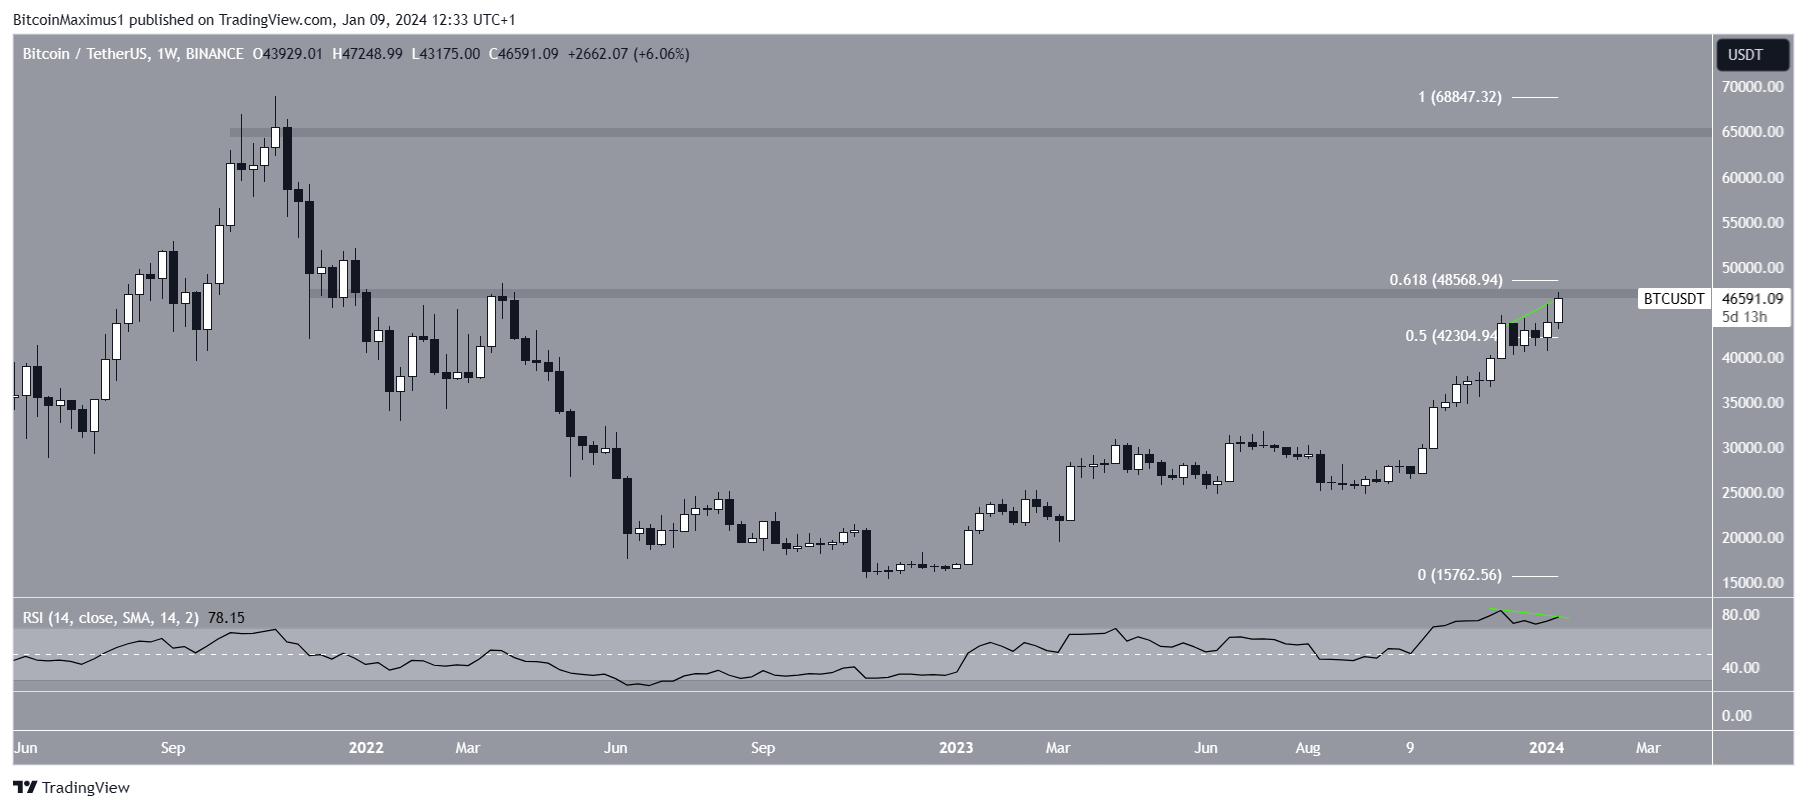
The weekly time frame chart shows that the BTC price has increased since the start of the year. The upward movement led to a high of $47,248 today.
The upward movement took the price above the 0.5 Fib retracement support level and close to the 0.618 one, coinciding with a horizontal resistance area.
This is the final resistance area before the all-time high.

Traders utilize the RSI as a momentum indicator to assess whether a market is overbought or oversold and whether to accumulate or sell an asset.
If the RSI reading is above 50 and the trend is upward, bulls still have an advantage, but if the reading is below 50, the opposite is true.
While the weekly RSI is increasing, it also generates bearish divergence, though still unconfirmed (green).
Read More: Where To Trade Bitcoin Futures
What Do the Analysts Say?
Cryptocurrency traders and analysts have a bullish outlook on the future BTC trend.
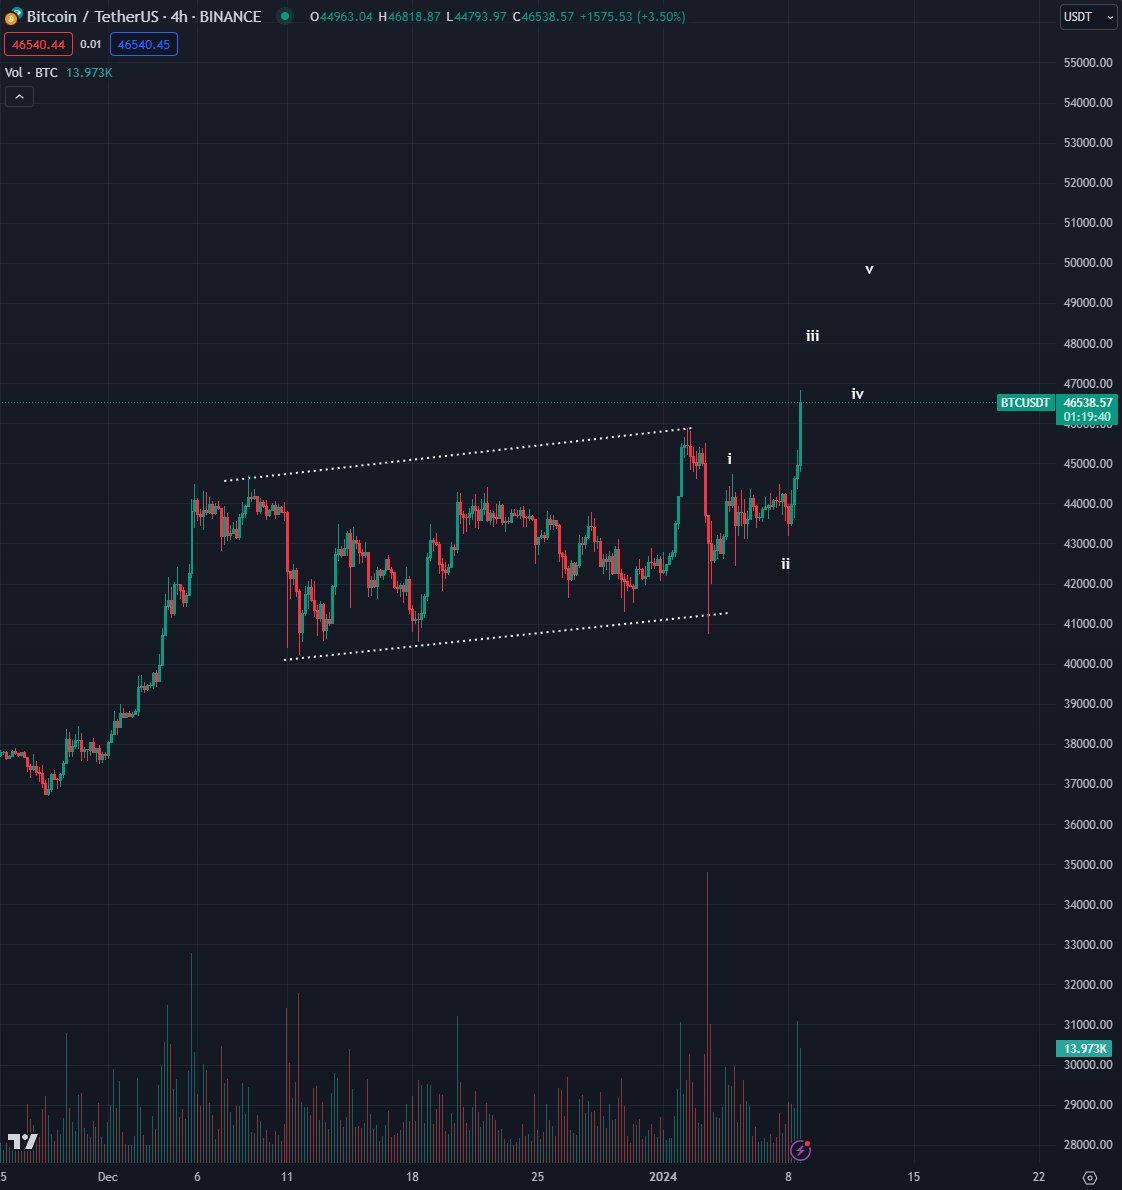
Bluntz Capital uses Elliott Wave theory to predict the BTC price upward movement will continue to at least $50,000. Technical analysts utilize the Elliott Wave theory to ascertain the trend’s direction by studying recurring long-term price patterns and investor psychology.

Cryptocurrency trader John Brown had an interesting take on the unlikely union the upcoming ETF will create. He tweeted:
ETFs will put Bitcoin into the baskets of many people that had no exposure before. They will turn from enemies to allies.
Jim Cramer, the host of Mad Money and notorious trading guru believes the BTC price will reach a peak soon.
Finally, Daan Crypto noted a large sell wall around $48,000 in Binance.
Read More: Who Owns the Most Bitcoin in 2024?
BTC Price Prediction: Will $50,000 be Reached?
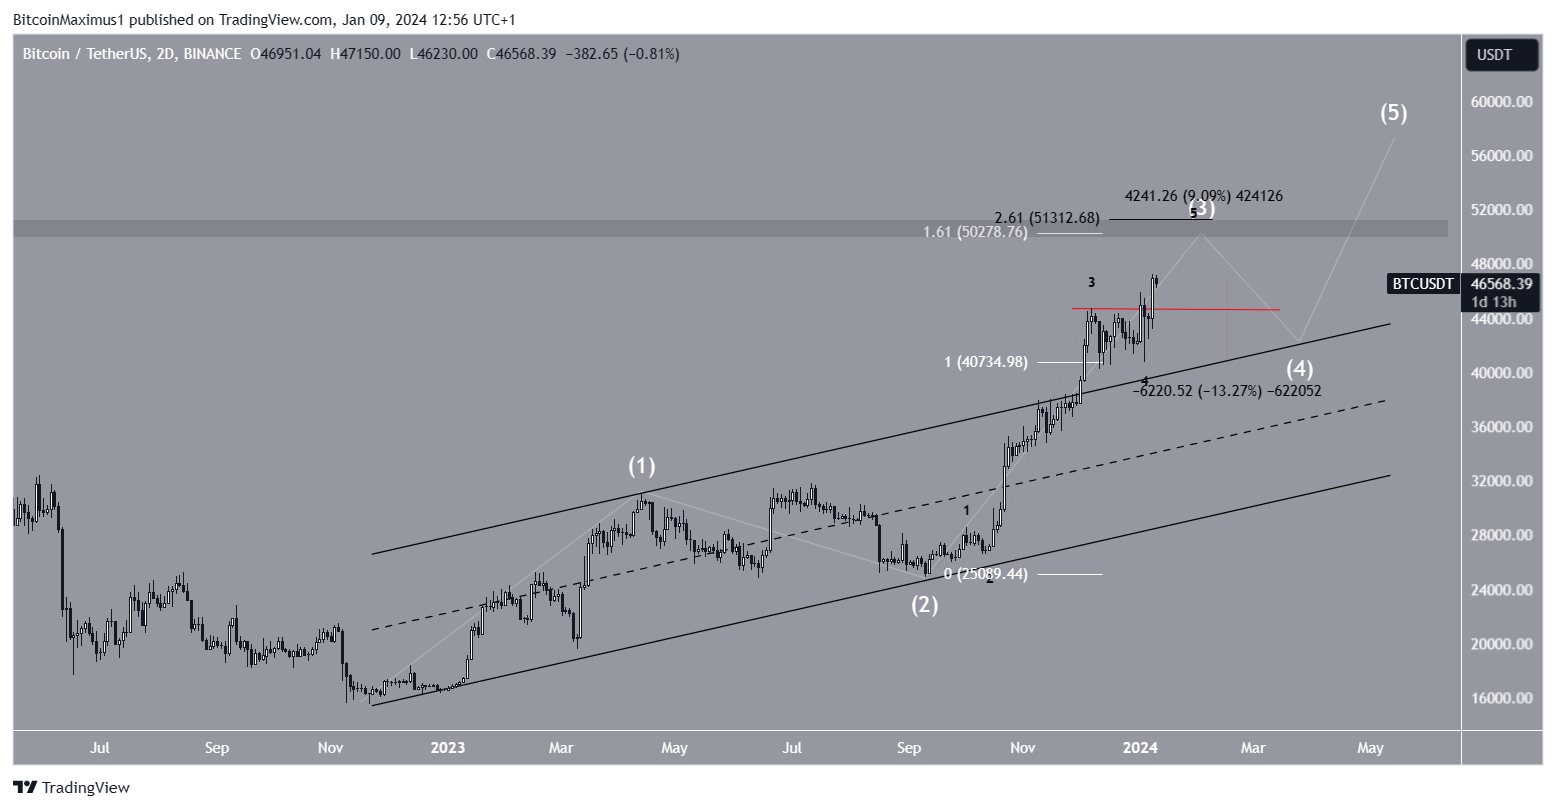
The 2-day time frame technical analysis suggests the price will continue increasing for a while before reaching the top. This is because of the wave count.
The most likely wave count suggests that BTC is nearing the top of wave three in a five-wave upward movement (white). The sub-wave count is in black, showing that BTC is also in the fifth and final sub-wave.
The most likely target for the completion of the upward movement is between $50,300-$51,300. The target is found:
- Giving waves one and three a 1:1.61 ratio
- The 2.61 external retracement of sub-wave four (black)
- A horizontal resistance area
The target is roughly 9% above the current price. Due to the confluence of several resistance levels, Bitcoin may top once it reaches it.

Despite this bullish BTC price prediction, a fall below the sub-wave three high (red) at $44,700 will mean the price has reached the top. Then, BTC could fall 13% to the previous channel’s resistance trend line at $41,000.
For BeInCrypto’s latest crypto market analysis, click here
Disclaimer
In line with the Trust Project guidelines, this price analysis article is for informational purposes only and should not be considered financial or investment advice. BeInCrypto is committed to accurate, unbiased reporting, but market conditions are subject to change without notice. Always conduct your own research and consult with a professional before making any financial decisions. Please note that our Terms and Conditions, Privacy Policy, and Disclaimers have been updated.

