Liveliness and Vaultedness are pivotal metrics in understanding the changes in the Bitcoin network.
At their core, these metrics revolve around the concept of ‘coinblocks’. A recently introduced metric from Glassnode, coinblocks represent a specific quantity of Bitcoin associated with a particular time duration since its last movement or transaction. In simpler terms, it’s a blend of the amount of Bitcoin and the time it has remained stationary.
Liveliness captures the network’s activity by focusing on ‘coinblocks destroyed.’ When a Bitcoin is transacted or spent, its associated coinblock is considered ‘destroyed’ as it breaks its previous duration of inactivity. The metric is then calculated by taking the cumulative sum of these destroyed coinblocks and dividing it by the cumulative sum of all coinblocks created since Bitcoin’s inception. This gives a ratio representing the relative activity of the Bitcoin network over time.
Conversely, Vaultedness offers a lens into the network’s ‘inactivity.’ It measures the proportion of coinblocks that remain ‘stored’ or unspent. Mathematically, Vaultedness is the sum of stored coinblocks divided by the sum of all coinblocks created. Alternatively, it can be viewed as 1 minus Liveliness, representing the inverse relationship between these two metrics.
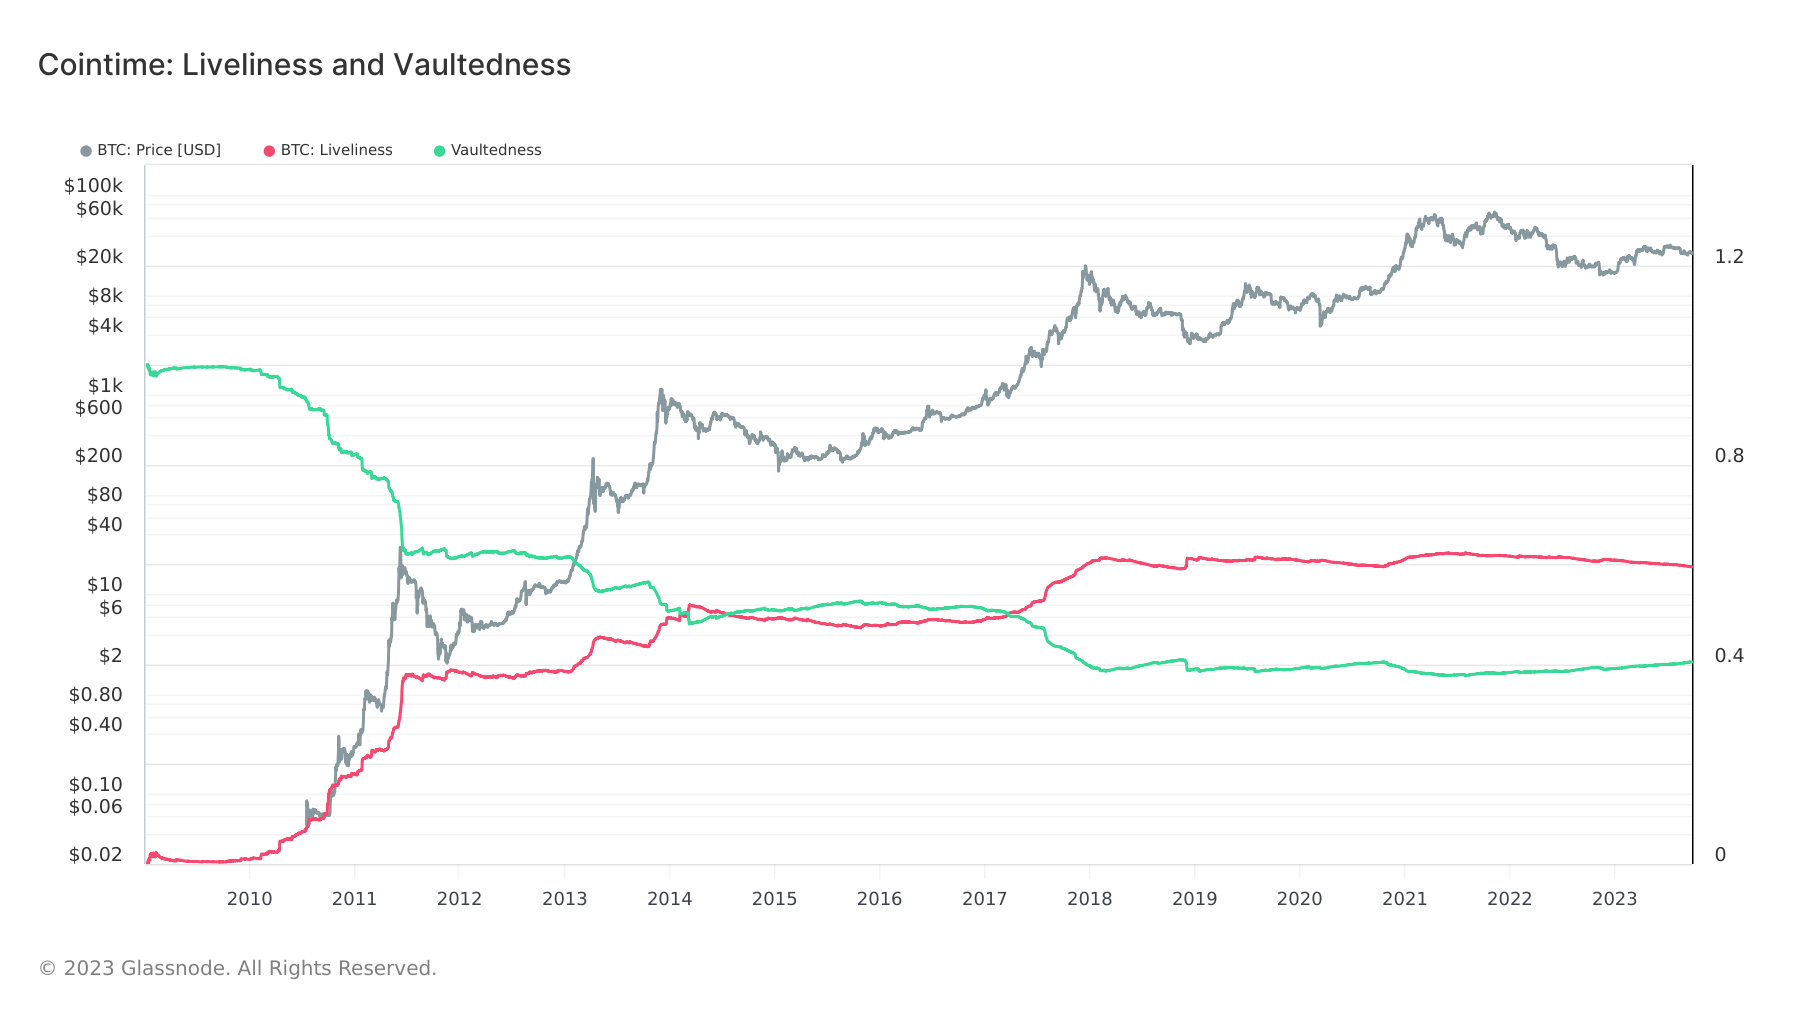
When the Genesis block was mined in January 2008, the Bitcoin network started with a Liveliness of 0 and a Vaultedness of 1. This initial state makes intuitive sense — since no coins had been spent, the network’s activity was non-existent, giving Liveliness its lowest value. Conversely, all coins were effectively “vaulted” or unspent, giving Vaultedness its maximal value.
Immediately after Bitcoin’s inception, Liveliness began its ascent, and Vaultedness started its descent. These trajectories continued until they intersected in March 2014. A subsequent period from July 2014 to April 2017 saw Vaultedness overshadowing Liveliness. However, post-April 2017, Liveliness took the lead and has maintained its dominance. It’s essential to note a trend reversal initiated in June 2021, where Vaultedness began to rise, and Liveliness started to decline.

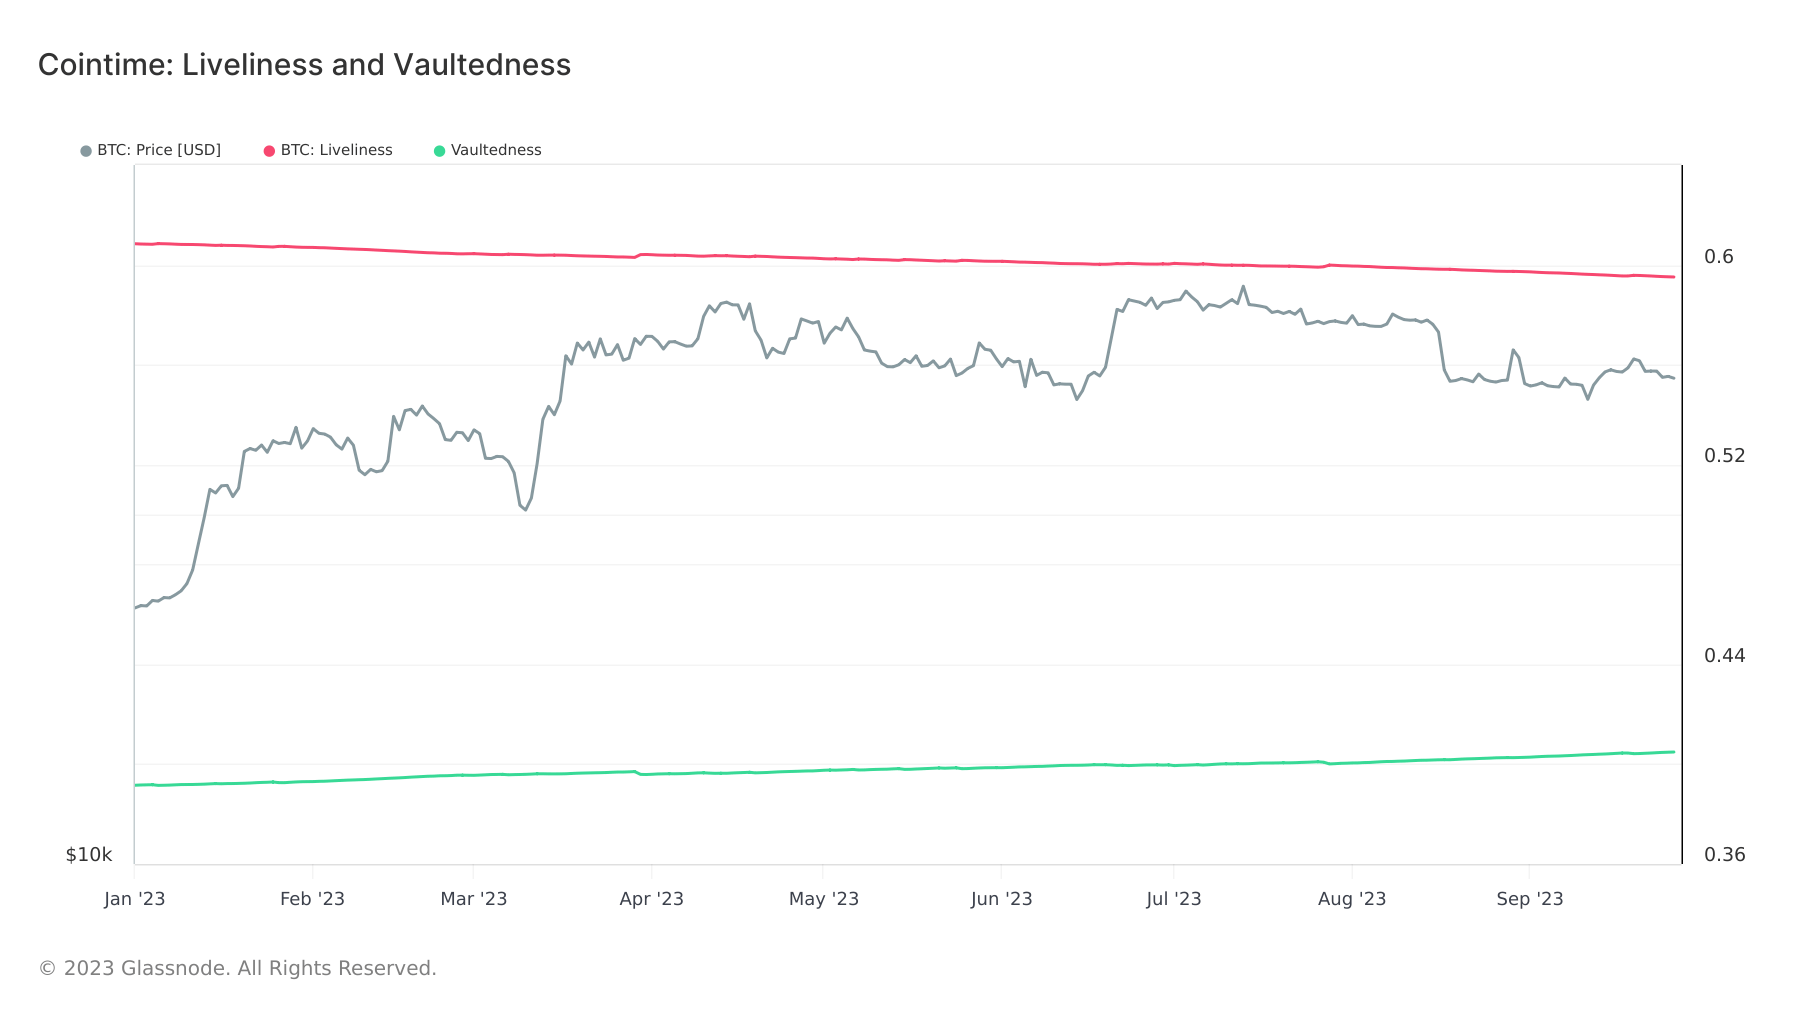
Since the beginning of the year, Liveliness decreased from 0.6 to 0.59—a relative change of -2.5% when viewed against its maximal potential value of 1. Meanwhile, Vaultedness increased from 0.39 to 0.4, reflecting a relative uptick of approximately 1.64%.

The increase in Vaultedness, a trend towards hodling, suggests growing confidence in Bitcoin’s value proposition. Interestingly, the trend of increased Vaultedness has defied Bitcoin’s price action, remaining consistent through both bull and bear markets.
The data indicates a balance between active trading and long-term holding, signaling Bitcoin’s evolving role in the financial landscape. The consistent dominance of Liveliness post-2017 and the recent trend reversal in 2021 might indicate a maturing market and shifting investor sentiments. As the market continues to evolve, metrics like Liveliness and Vaultedness will remain crucial in decoding the broader narrative surrounding Bitcoin’s value and potential.
It’s becoming evident that the cryptocurrency market is not just about price dynamics. The dominance shift between Liveliness and Vaultedness underscores Bitcoin’s journey from a speculative novel asset to a recognized store of value, with the recent trends suggesting a renewed belief in its long-term potential.


